Trend Chart – Dynamic Content Metrics
The trend chart represents a central component of the webLyzard dashboard, based on the selected data sources and time interval. The default setting is two months, which can be changed using the date selector. Whenever different sources or topics are selected, dynamic transitions show how these changes impact the displayed data sets. Recently added features such as moving averages and adaptive baselines increase the flexibility of the trend chart component. An integrated data export function also allows reusing the shown data in external third-party applications.
Time Series Data
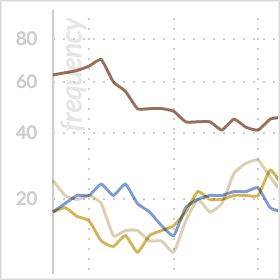
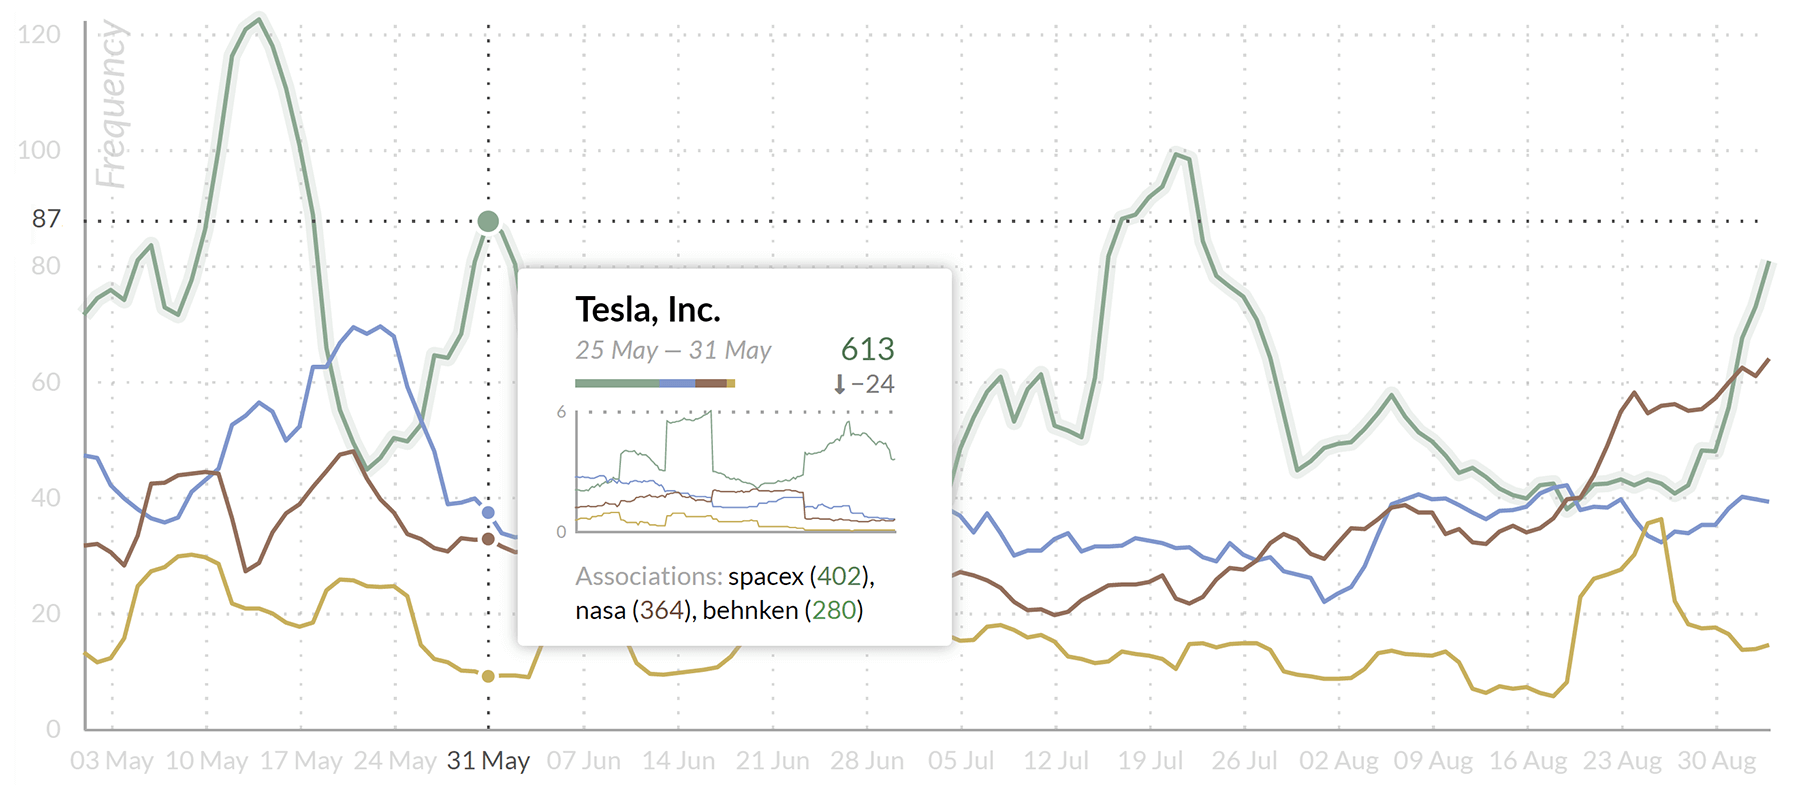
The line chart depicts the evolution of data indicators over time. This includes key metrics extracted from Web content as well as imported time series data, for example Statistical Linked Data. The system shows these key metrics either in the context of the global filter or for the entire document space. If the global filter is set (= text input field in the upper left corner), the chart reveals facets of filtered coverage to visualize e.g. the language or source distribution over time. Hovering above data points displays tooltips with the top three keyword associations. This helps to identify emerging trends and shows what has caused a particular peak in the chart. Clicking on a data point activates additional tooltip actions. The menu on the left provide access to the following data sets:
- Frequency aggregates the number of occurrences on a given day, week or month (depending on the moving average setting).
- Share of Voice is a relative measure of attention that divides frequency by the total number of documents published in the moving average interval. This adjusts for cyclic changes in total coverage such as weekends or holidays.
- Impact is a modified frequency measure that considers the reach of a document’s source. Reach is based on a Website’s traffic statistics or the number of followers in the case of social media postings.
- Sentiment (mean) shows the average sentiment towards a certain topic.
- Disagreement (standard deviation of sentiment) reflects how contested a topic is. The term ‘oil spill’, for example, has a low standard deviation since everyone agrees on its negative connotation.
Trend Chart Controls
Complementing the time series selection and moving average specification described above, the context menu allows activating additional diagrams such as the donut chart or the radar chart.
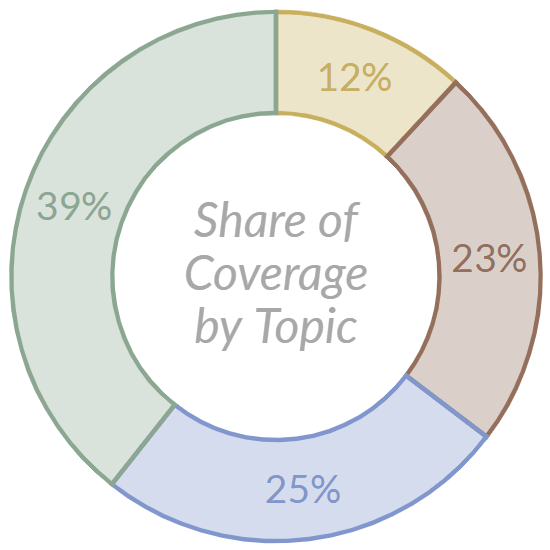
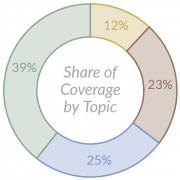 Donut Chart. This radial diagram shows the data of the line chart in aggregated form. Alternatively, a bar chart is available via the settings symbol in the upper right corner. It is synchronized with the line chart to highlight the connection. Adaptive tooltips offer keywords per topic for frequency data, or the most important positive and negative associations with the chosen set of topics for sentiment data.
- Additional Features. The context menu of the trend chart offers an optional moving average calculation. If disabled, the charts present the raw data to reveal specific events. If enabled, the focus of the analysis shifts to trend detection. Available intervals are 7, 30 and 60 days for daily granularity, and 24, 48 and 72 hours for hourly granularity. Depending on the dashboard configuration, the contextual menu may offer additional features such as the WYSDOM success metric or the Brand Reputation Radar. Users can enlarge the trend graph via the icon in the upper right corner.
Data Export
An integrated export function allows retrieving the full data set consisting of daily frequency, sentiment, and disagreement values for the selected time interval. Available file formats include native MS Excel and comma-separated CSV. This supports a range of external applications including data warehouses, business intelligence solutions, AI tools as well as statistical packages such as R and SPSS.

