UNEP Live – United Nations Project
The United Nations Environment Programme (UNEP) has adopted the webLyzard platform to build a pioneering Web intelligence portal for global environmental indicators and related communication flows. The UNEP portal analyzes social media postings to extract public opinion trends on air quality, biodiversity and climate change. It also aggregates related content from the Web sites of news media organizations, policymakers and environmental organizations. Fully integrated into the UNEP knowledge management platform, webLyzard helps align articles and postings from these online sources with key environmental indicators. Thereby, the system supports stakeholders in their efforts to communicate and promote Sustainable Development Goals (SDGs).
Try out the UNEP Live Visual Analytics Dashboard
Sharing Environmental Knowledge
 UNEP is the voice for the environment within the United Nations system. For almost 50 years, UNEP has been actively promoting the coherent implementation of the environmental dimension of sustainable development and serves as an authoritative advocate for the global environment. UNEP uses the webLyzard platform to inform citizens about the relevance of environmental online communication in decision making. In collaboration with the Research Center for New Media Technology of MU Vienna, webLyzard significantly extended the capabilities of UNEP Live. A system-wide approach facilitates the sharing of environmental knowledge among member countries, research networks, communities of practice, and society.
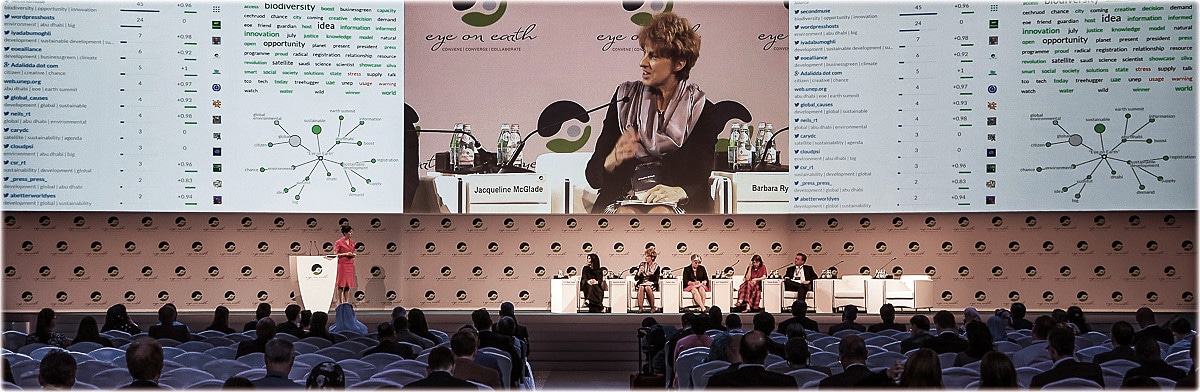
Presentation of the Platform by Prof McGlade, UNEP Chief Scientist, at the Eye on Earth Summit 2015
Presentation at the UNEA-2 Summit
The system demonstrated its reliability and advanced analytic features during the 2nd Session of the United Nations Environment Assembly (UNEA-2). The event was held 23-27 May 2016 at the UNEP Headquarters in Nairobi, Kenya. Already a couple of weeks before the event the SDG intelligence platform started to track the intense online coverage about the event itself, in real time and across multiple languages. During the event, we introduced the system as a live demo in invited talks at the Big Data Expo and the UNEA2 Science and Policy Forum (see related video tutorial and slideshare online presentation).


Tracking the Evolution of the Public Dialog
To differentiate the environmental data gathered, the UNEP portal automatically distinguishes factual information from individual, emotionally driven expressions of opinion. Capturing stakeholder perceptions of sustainability issues helps identify opinion leaders. It also structures the online dialog in terms of prevailing topics and geographic location. The result is a comprehensive repository of environmental knowledge. The system aligns social media postings contained in this repository with specific environmental indicators. Visual tools then help to explore communication threads in the context of these indicators. This enables environmental stakeholders to understand contested issues, track the evolution of public dialog over time, and identify key indicators that are shaping public opinion.
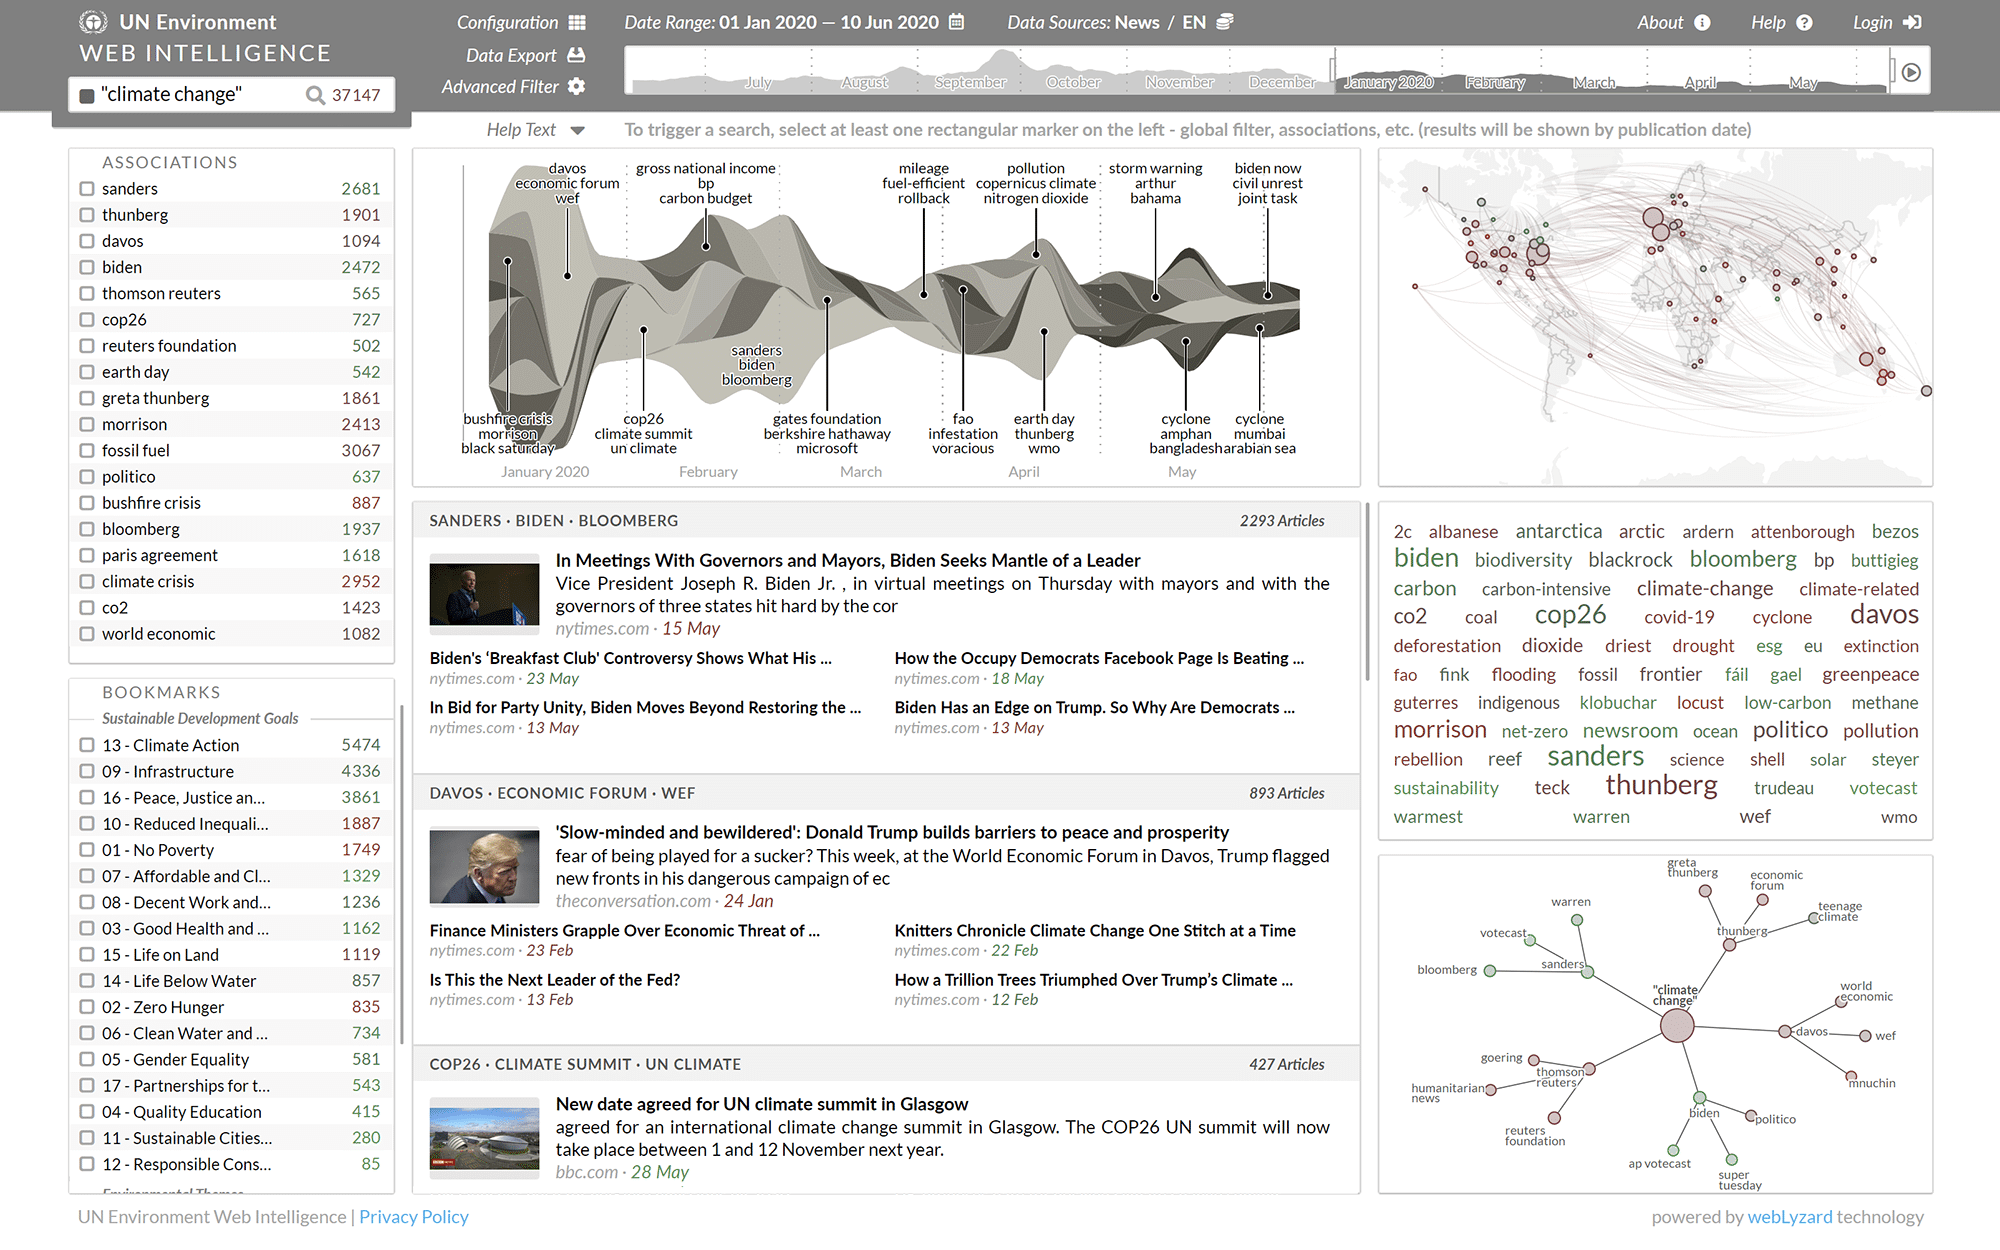
UNEP Dashboard – Searching and Seeing
Citizens and organizations can use the webLyzard dashboard to explore the latest environmental information on UNEP Live. A word tree shows in which context terms such as air quality, biodiversity and climate change are discussed around the world. The geographic map displays origin and location targets of a communication. Thereby, it makes it easier to track emerging stories and environmental trends. The entity map enable users to explore relations among different organizations, individuals, or places. Decision makers highly value the built-in capabilities to spot geographic patterns, identify shifts in opinions on environmental matters, and track stakeholder influence.
UNEP Live Roadmap
webLyzard has a long tradition of supporting science communication and provide visual analytics solutions for major international organizations such as the U.S. National Oceanic and Atmospheric Administration (NOAA). The DecarboNet FP7 project also applied these methods to transform the Media Watch on Climate Change into a collective awareness platform that supports collaborative editing. The goal was to better understand how information is created and shared in social media communities. We hope to continue this work as part of Horizon Europe and the EU Green Deal.
References
- Scharl, A., Herring, D., Rafelsberger, W., Hubmann-Haidvogel, A., Kamolov, R., Fischl, D., Föls, M. and Weichselbraun, A. (2017). Semantic Systems and Visual Tools to Support Environmental Communication, IEEE Systems Journal, 11(2): 762-771.
- Scharl, A., Föls, M., Herring, D., Piccolo, L., Fernandez, M. and Alani, H. (2016). Application Design and Engagement Strategy of a Game with a Purpose for Climate Change Awareness, Internet Science, 3rd International Conference, INSCI-2016 (= Lecture Notes in Computer Science, vol. 9934). Eds. F. Bagnoli et al. Florence, Italy: Springer. 97-104.
- Scharl, A., Hubmann-Haidvogel, A., Weichselbraun, A., Lang, H.-P. and Sabou, M. (2013). Media Watch on Climate Change – Visual Analytics for Aggregating and Managing Environmental Knowledge from Online Sources. 46th Hawaii International Conference on Systems Sciences (HICSS-46). R.H. Sprague. Maui, USA: IEEE Press: 955-964.
