Emotion Detection – Affective Computing
Emotion detection algorithms for news and social media coverage help to investigate trends and differing perceptions of various stakeholder groups. webLyzard detects emotions with affective computing algorithms that classify and sort search results along multiple emotional dimensions such as Joy, Trust, Anger and Fear. Translated into color coding, these dimensions enrich visualizations such as tag clouds and geographic maps.
Affective Computing
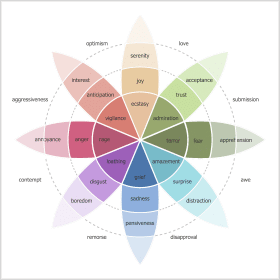
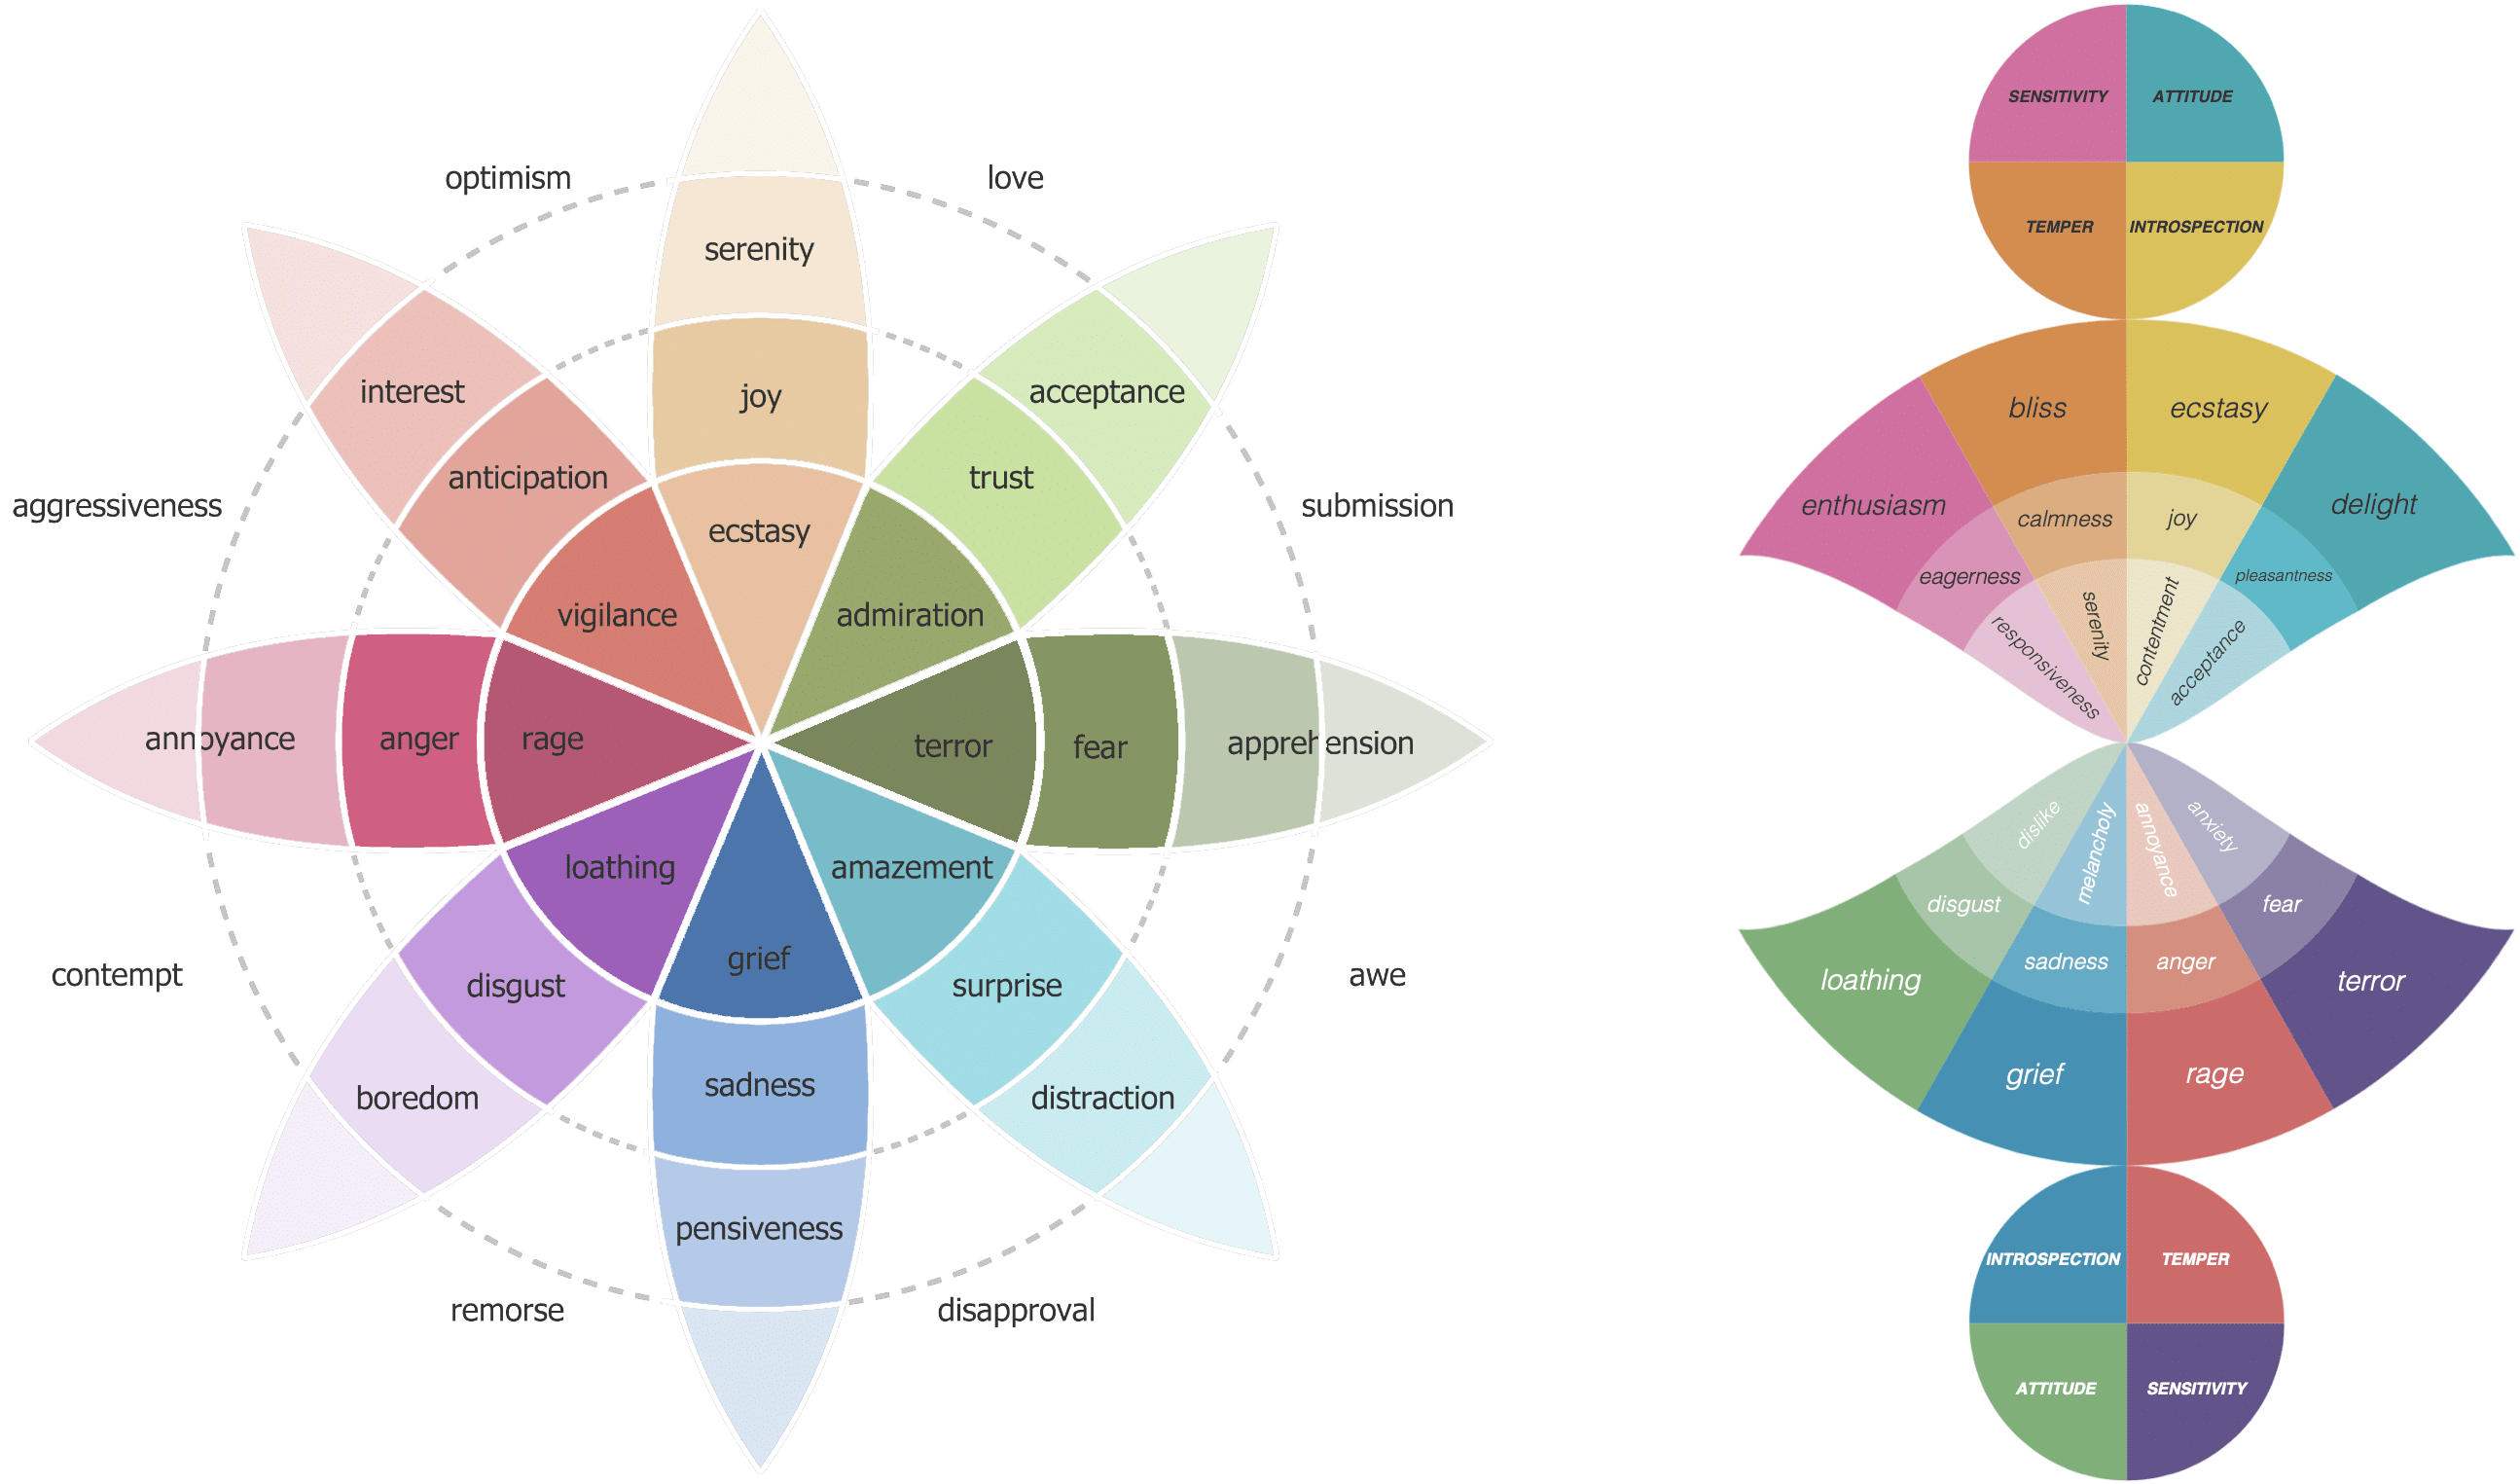
Affective models for opinion mining differ in their goals and complexity. Sentiment analysis, for example, classifies content streams into positive and negative expressions. It uses sentiment lexicons together with artificial intelligence-based machine learning methods to determine the polarity of sentences and documents. More complex affective models consider the work of psychologists. They provide more fine-grained classifications into emotional categories. Many of these models also define sub-categories for a more nuanced representation. A common distinction is the intensity of the expressed emotion. The following figure compares two popular affective models that can guide the automated classification of human emotions. On the left, the figure shows Robert Plutchik’s Wheel of Emotions, next to Erik Cambria’s Hourglass of Emotions.
Tailored Models for Data-Driven Communications
Even the most granular affective models combined with sophisticated machine learning approaches do not address the inherent problem that an organization’s strategic positioning goals will often deviate from existing affective models. Certain emotions such as “Joy” and “Trust” represent desirable associations for most brands. Specific communicative goals, however, are carefully formulated by communications managers and marketing professionals. They are typically not restricted to emotions, but can also include desired associations with concepts such “innovation” and “big data”. At the same time, it is equally important to detect undesired aspects of the coverage. Neither the desired nor the undesired aspects correspond to general frameworks. They stem from the specific competitive position of an organization. The webLyzard Stakeholder Dialogue and Opinion Model (WYSDOM) takes this specific position into account by complementing emotion detection with a tailored success metric. Regular updates align this metric with an organization’s evolving communication goals.
Emotion Detection Roadmap
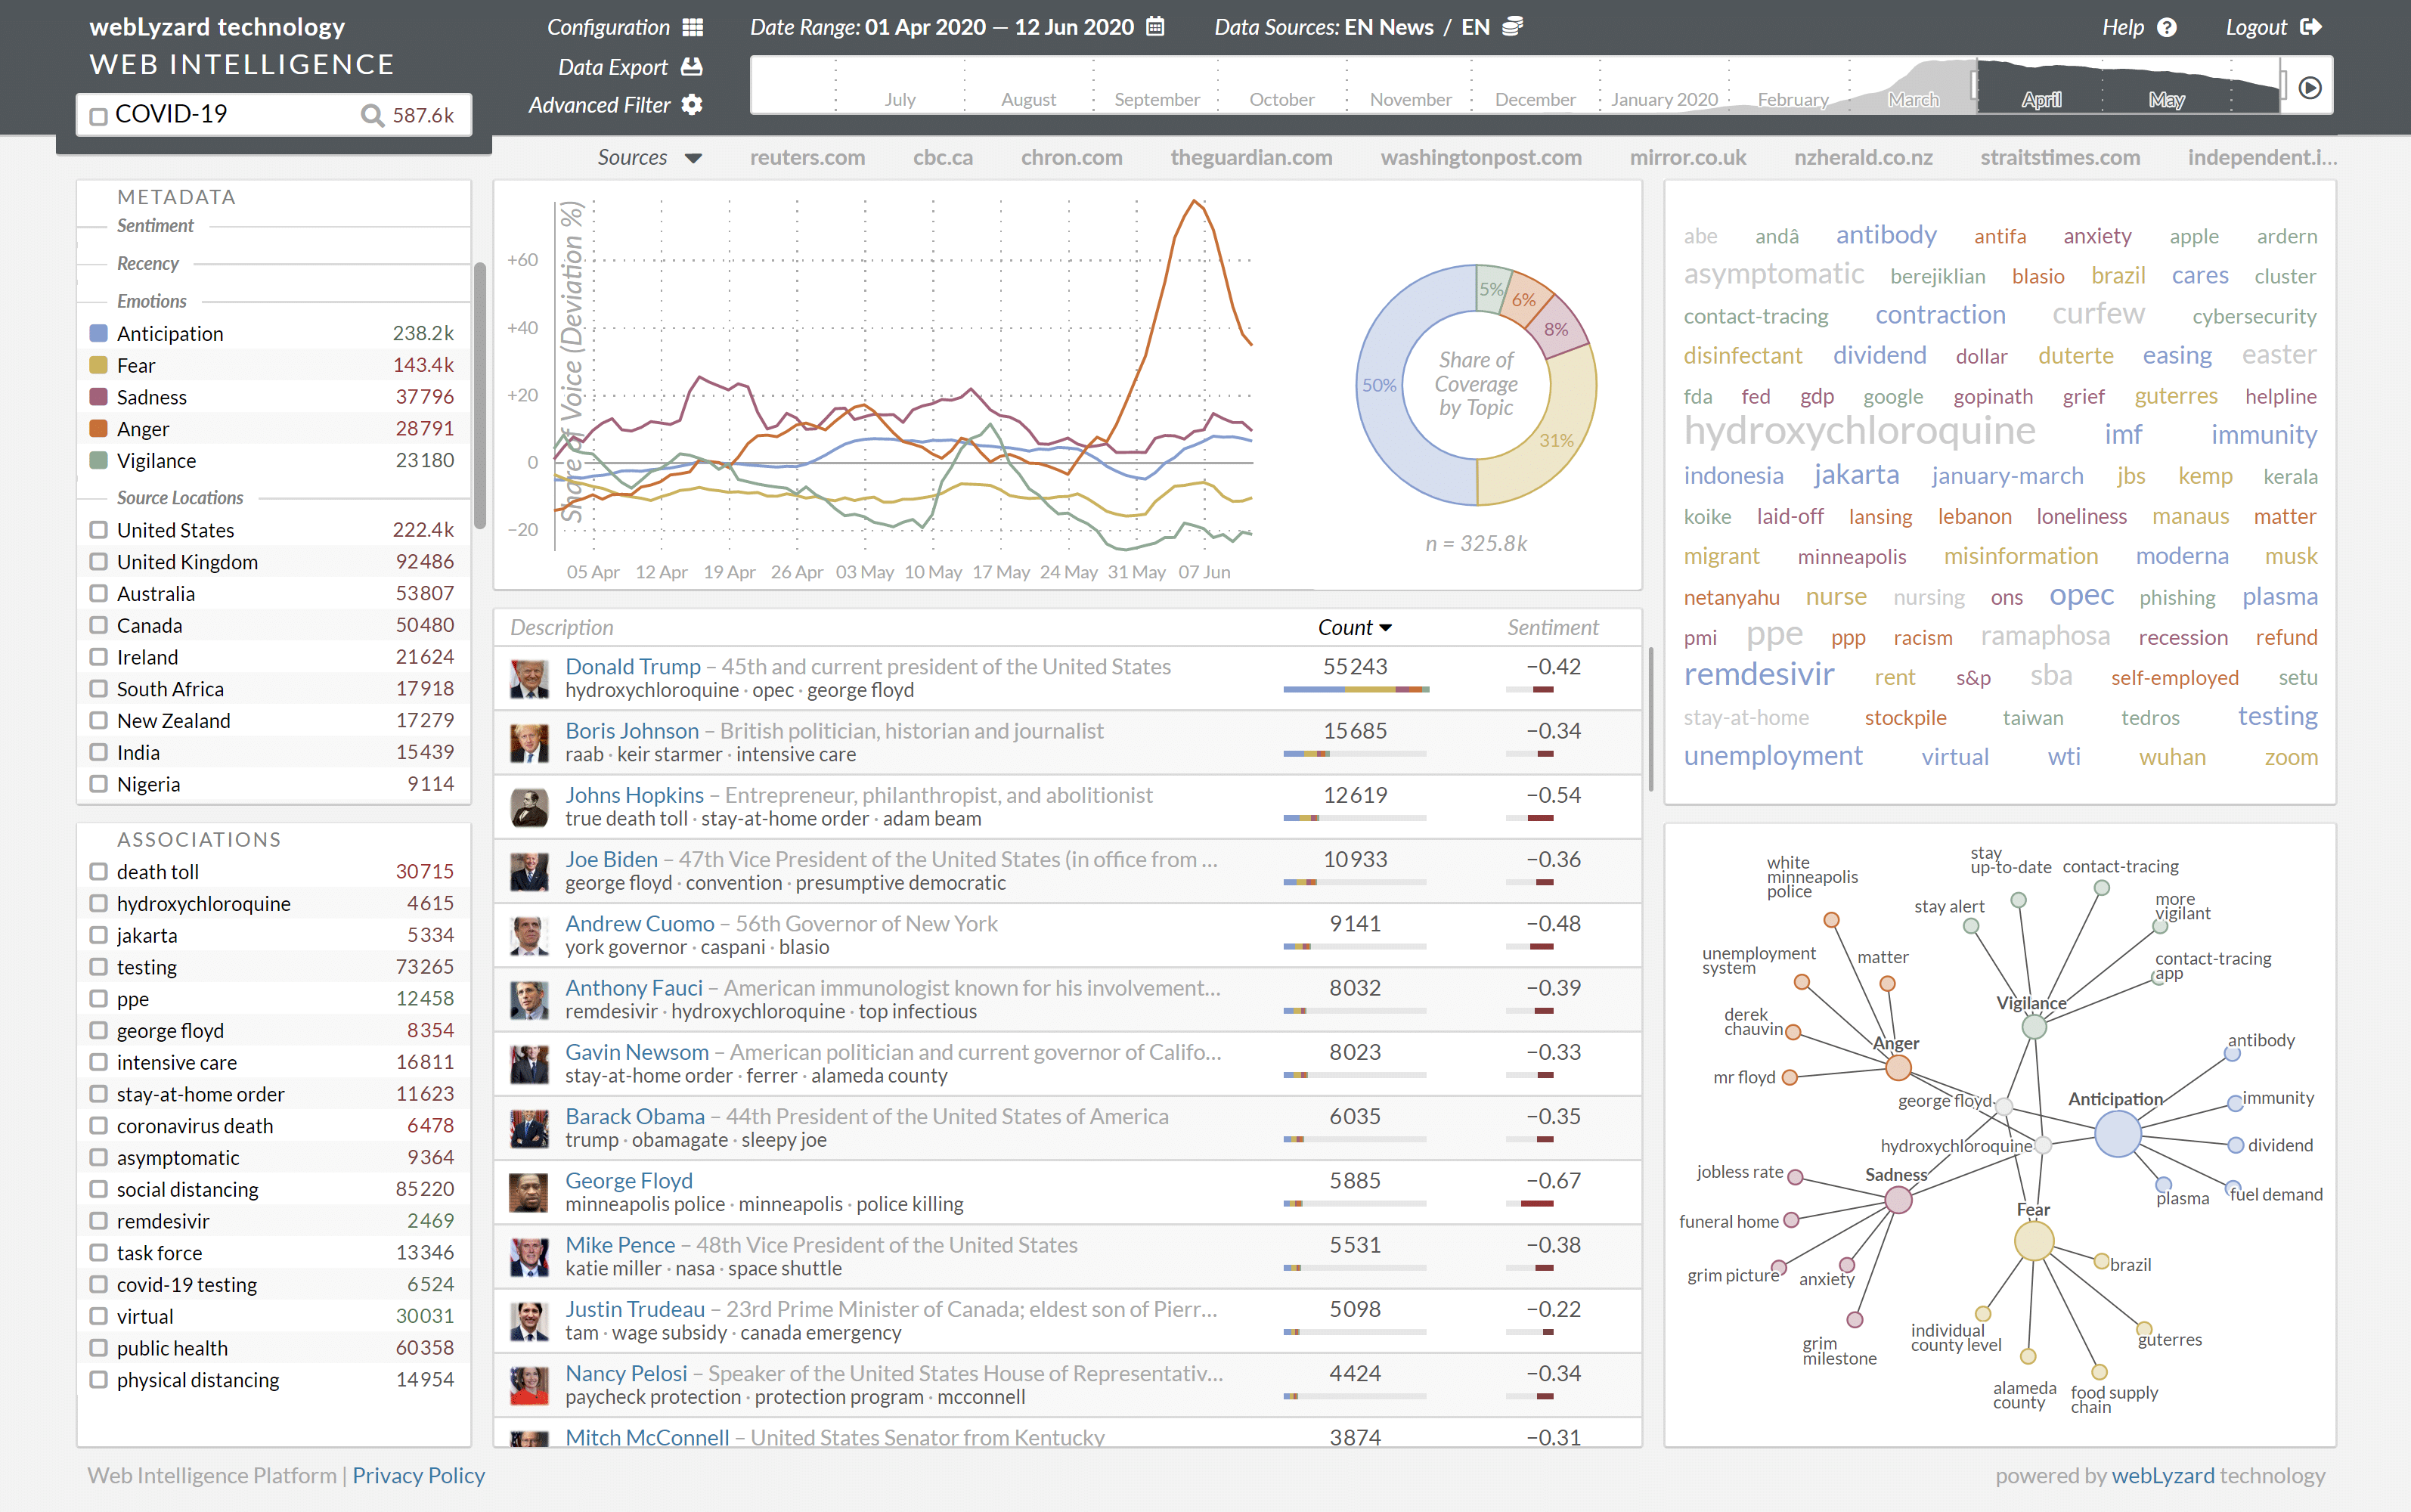
Work in the research projects ReTV (Re-Inventing TV for the Digital Age) and EPOCH (Event Prediction from Hybrid Datasets) has extended the emotion detection component to support multiple affective models. In a first step, the projects experimented with several AI-based approaches to achieve maximum accuracy. Initial results of this work then helped investigate the online coverage of the coronavirus pandemic. The resulting Corona Mood Barometer sheds light on the prevalent emotions in the public debate. The following screenshot shows how the categories of Plutchik’s Wheel of Emotion have been integrated into the Metadata Sidebar of the webLyzard visual analytics dashboard.
Emotion Detection References
- Weichselbraun, A., Steixner, J., Braşoveanu, A.M.P., Scharl, A., Göbel, M. and Nixon, L.J.B. (2021). Automatic Expansion of Domain-Specific Affective Models for Web Intelligence Applications, Cognitive Computation, 14(1): 228-245.
- Susanto, Y., Livingstone, A.G., Ng, B.C. and Cambria, E. (2020). The Hourglass Model Revisited, IEEE Intelligent Systems, 35(5): Forthcoming.
- Scharl, A., Hubmann-Haidvogel, A., Jones, A., et al. (2016). Analyzing the Public Discourse on Works of Fiction – Automatic Emotion Detection in Online Media Coverage about HBO’s Game of Thrones, Information Processing & Management, 52(1): 129-138 [Best Paper Award – Honorable Mention].
- Plutchik, R. (2001). The Nature of Emotions, American Scientist, 89(4): 344-350.

