 Source: CDC
The Corona Mood Barometer
Analysis of the Public Debate from March 2020 to December 2022
Aggregating digital content streams from Web sites and social media channels, the Corona Mood Barometer uses automatic story detection and emotion analysis to identify the latest trends. A Web-based visual analytics dashboard helps to better understand what drives the public debate. It also sheds light on how government responses to the COVID-19 pandemic are perceived across the various countries.
COVID Quo Vadis? Predicting Media Interest
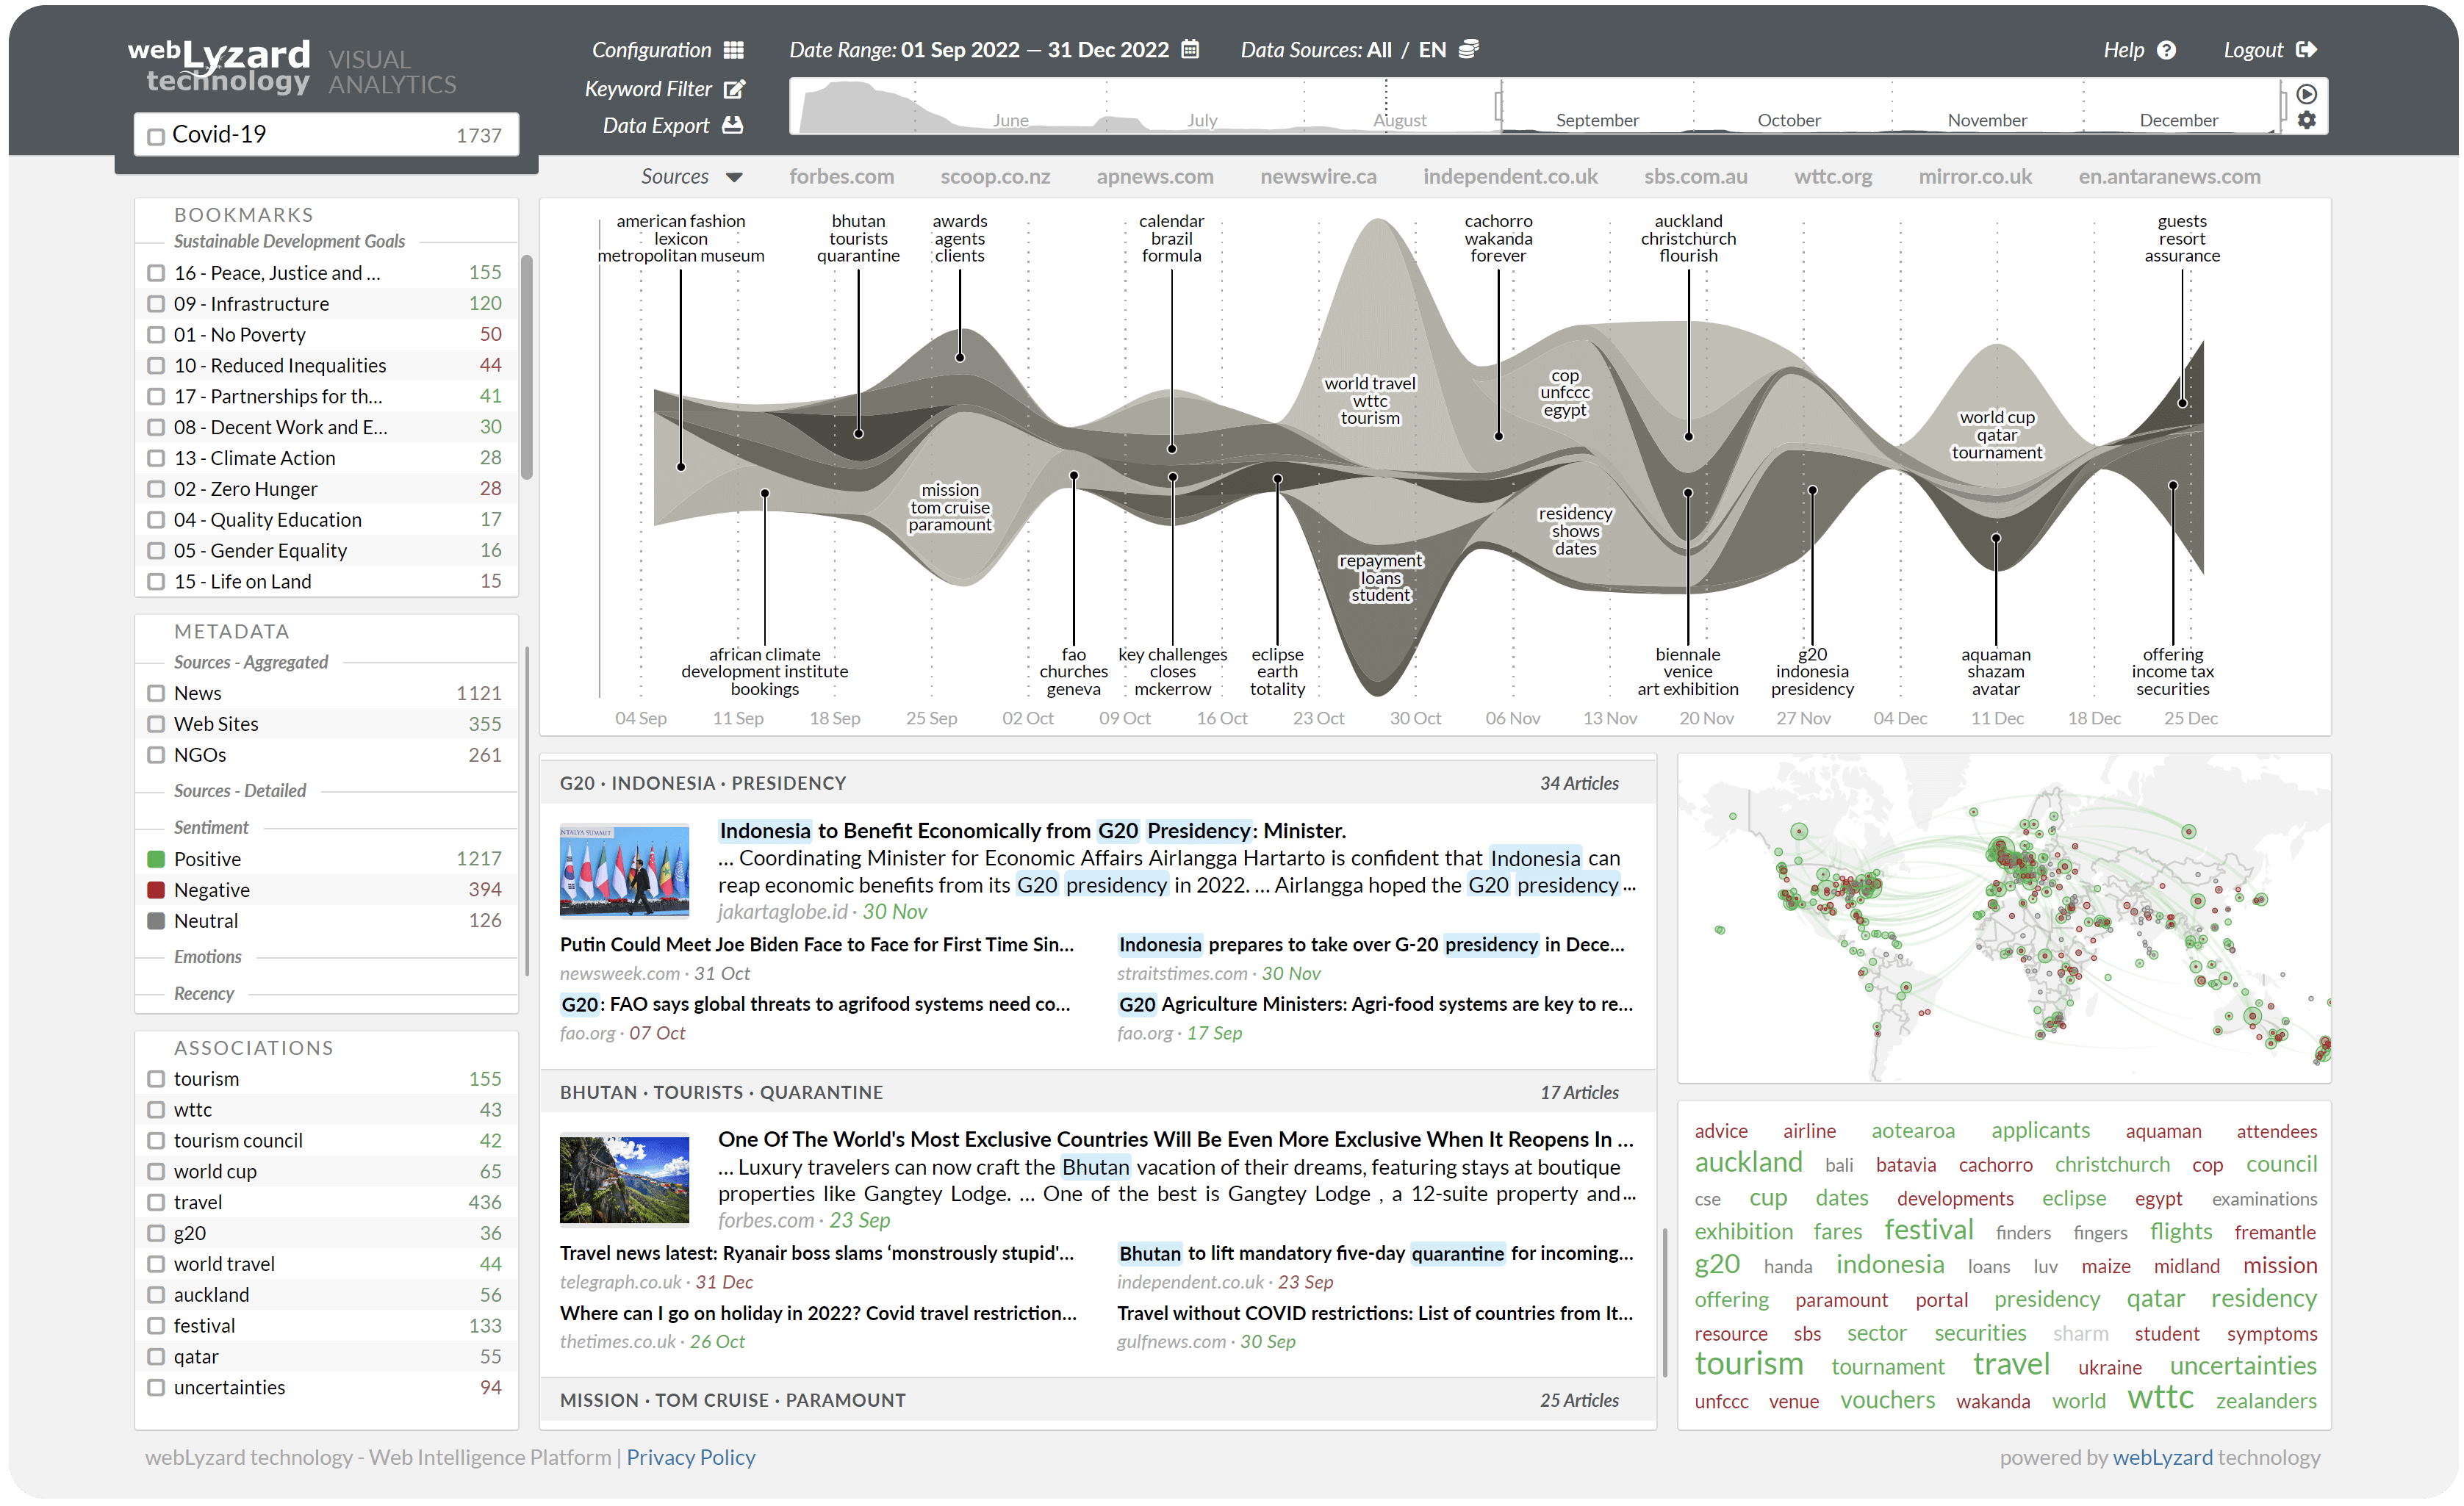
The screenshot below concludes the Corona Mood Barometer’s series of content analyses. The dashboard reveals future Corona-related events and topics that will likely dominate the public debate between September and December 2022. This example demonstrates the predictive capabilities of the EPOCH research project, coupled with the text classification algorithms of the GENTIO project.
The left sidebar classifies the search results by topic (alignment with the 17 Sustainable Development Goals – SDGs), content source (News, Web Sites, NGOs), and by sentiment (positive vs. negative). The story graph in the center presents the sequence of events. The most dominant topic is the ongoing impact of the COVID-19 pandemic on tourism – e.g., flight schedule changes or the planned easing of quarantine rules in specific countries. There are also Corona-related discussions in conjunction with upcoming events such as the G20 Summit in Indonesia or the FIFA World Cup World in Qatar. The geographic map on the right shows the regional distribution of these events. The tag cloud below, color-coded by sentiment, confirms that tourism, the airline industry, and major international events dominate the outlook for the remainder of 2022.
Race to Herd Immunity: COVID-19 Vaccine Tracking
As of May 2021, the European Medicines Agency (EMA) has approved the COVID-19 vaccines of Pfizer / BioNTech, Moderna, AstraZeneca, and Johnson & Johnson. The following figure shows media and NGO associations with those four vaccines between January and May 2021. It also includes Germany’s CureVac, another vaccine candidate currently under evaluation by the EMA. The geographic map on the right reflects the regional distribution of the online coverage. Notable patterns in references to the individual vaccines include the clusters of Pfizer / BioNTech coverage in Israel, for example, or AstraZeneca in Oxford, UK.
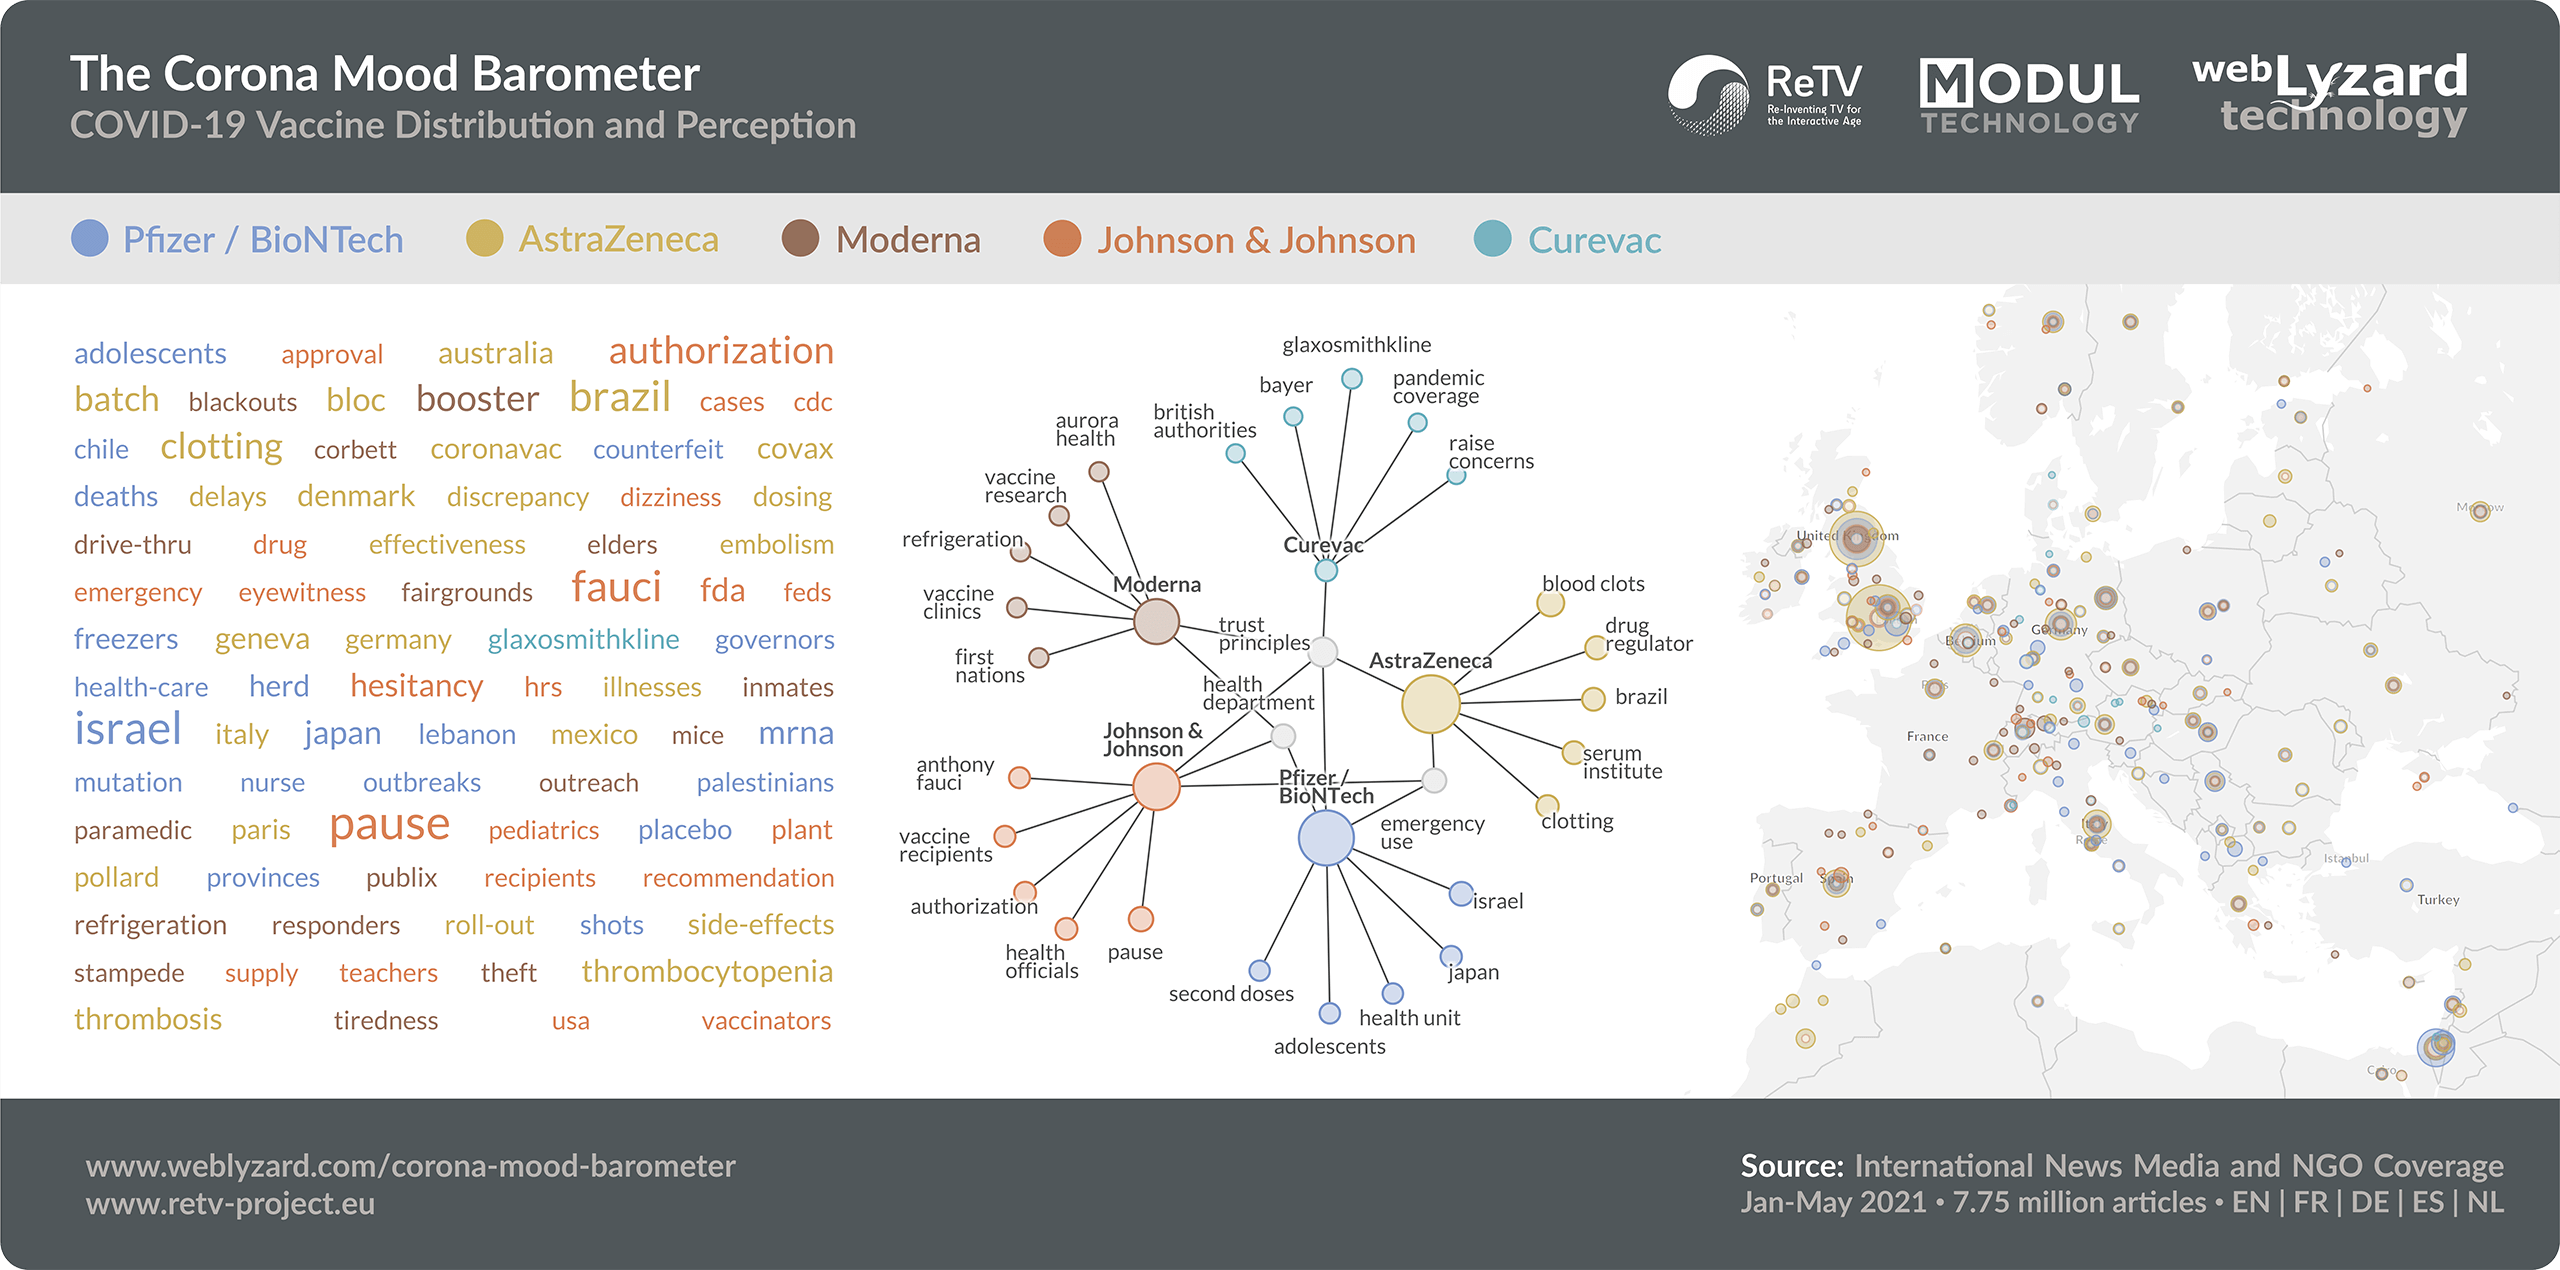
The current availability of several options is a result of vaccine candidates having progressed through clinical phases at record speed. In the fourth quarter of 2020, Pfizer / BioNTech, Moderna and AstraZeneca announced promising results from their phase 3 trials. The results showed efficacy rates of more than 90% for both mRNA vaccines, and about 70% for the adenovirus-based vaccine of AstraZeneca. The news accelerated efforts to win the race for the first vaccine rollout.
 The video on the right depicts the evolution of news media coverage in November 2020. It highlights the significant global impact of the company announcements on the public debate. The analysis shows how this has shifted global media attention. Journalists now focus on the authorization process, availability forecasts and fair distribution strategies. Differences in the required refrigeration temperature, for example, triggered online discussions that the lack of suitable fridges might slow down vaccine distribution.
Visual Storytelling
Which stories accompany us as many countries come out of lockdown? To answer this question, the Corona Mood Barometer provides a story graph visualization that automatically clusters content streams into a set of emerging stories (webLyzard’s cluster map is an alternative visual representation). Such stories are groups of related news articles and social media postings. They indicate major events, for example, or intervention strategies to control the pandemic.
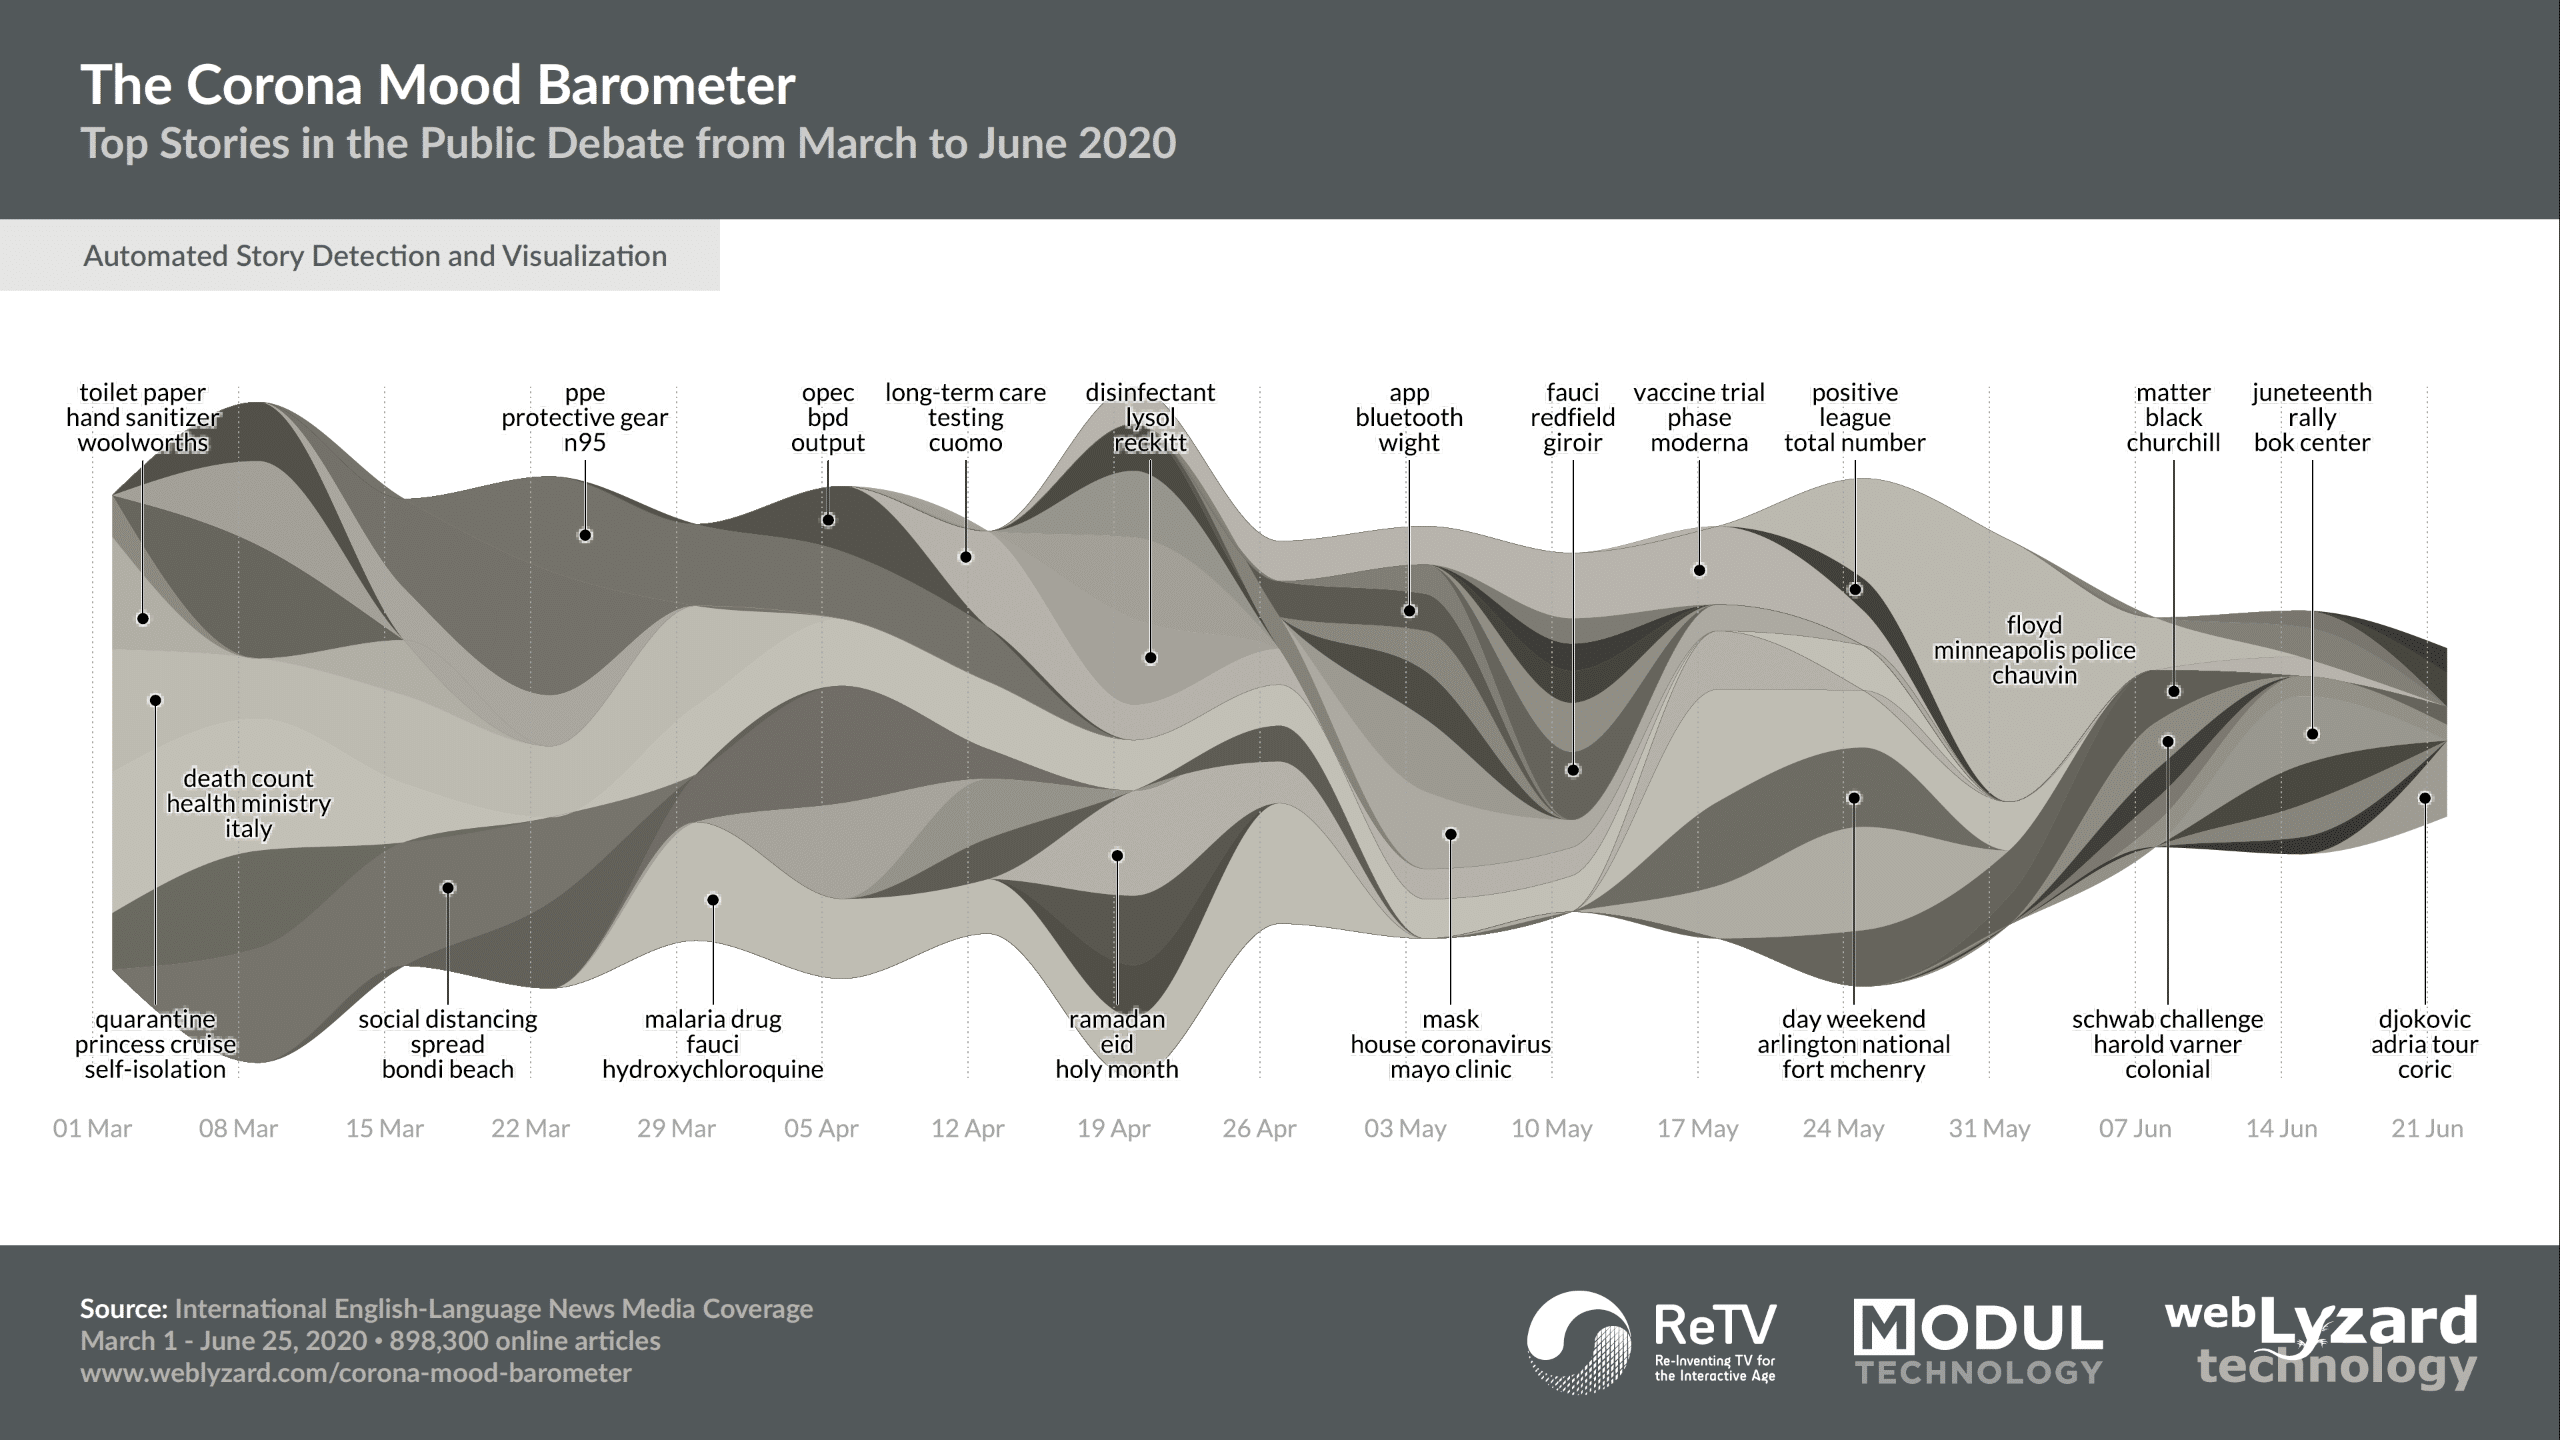
The story graph illustrates perceptions of the enacted lockdown and social distancing measures (terms in Italic appear as labels). While there has been widespread acceptance in many European countries, as shown in our previous analysis of the coverage in Austria, the situation is more divided internationally. Protesters complained about an overreaction by health authorities. In particular, some of them perceived them a threat to their personal freedom. The first announcements of lockdown measures also brought shortages of various product categories including toilet paper, hand sanitizers and protective masks. Eyewitness accounts of the outbreak and a shortage of ventilators and intensive care beds in Italy and Iran highlighted the dramatic consequences of the exponential coronavirus spread. The rapidly increasing number of infections strengthened public support of government interventions.
While the measures in Europe succeeded to flatten the curve, other countries had been less successful in containing the outbreak. Examples included Brazil and the United States. Partial reopening plans and the protests in Minneapolis against racism and police brutality fueled the debate on the timing of the reopening. They also triggered a discussion about whether the protests might contribute to a second wave.
Global Corona Mood Over Time
Text mining methods to classify content according to Plutchik’s Wheel of Emotions identified five characteristic emotions during the prolonged period of confinement in May 2020. The most striking peaks in the time series of the Corona Mood Barometer align with Anticipation, Vigilance, Fear, Anger and Sadness.
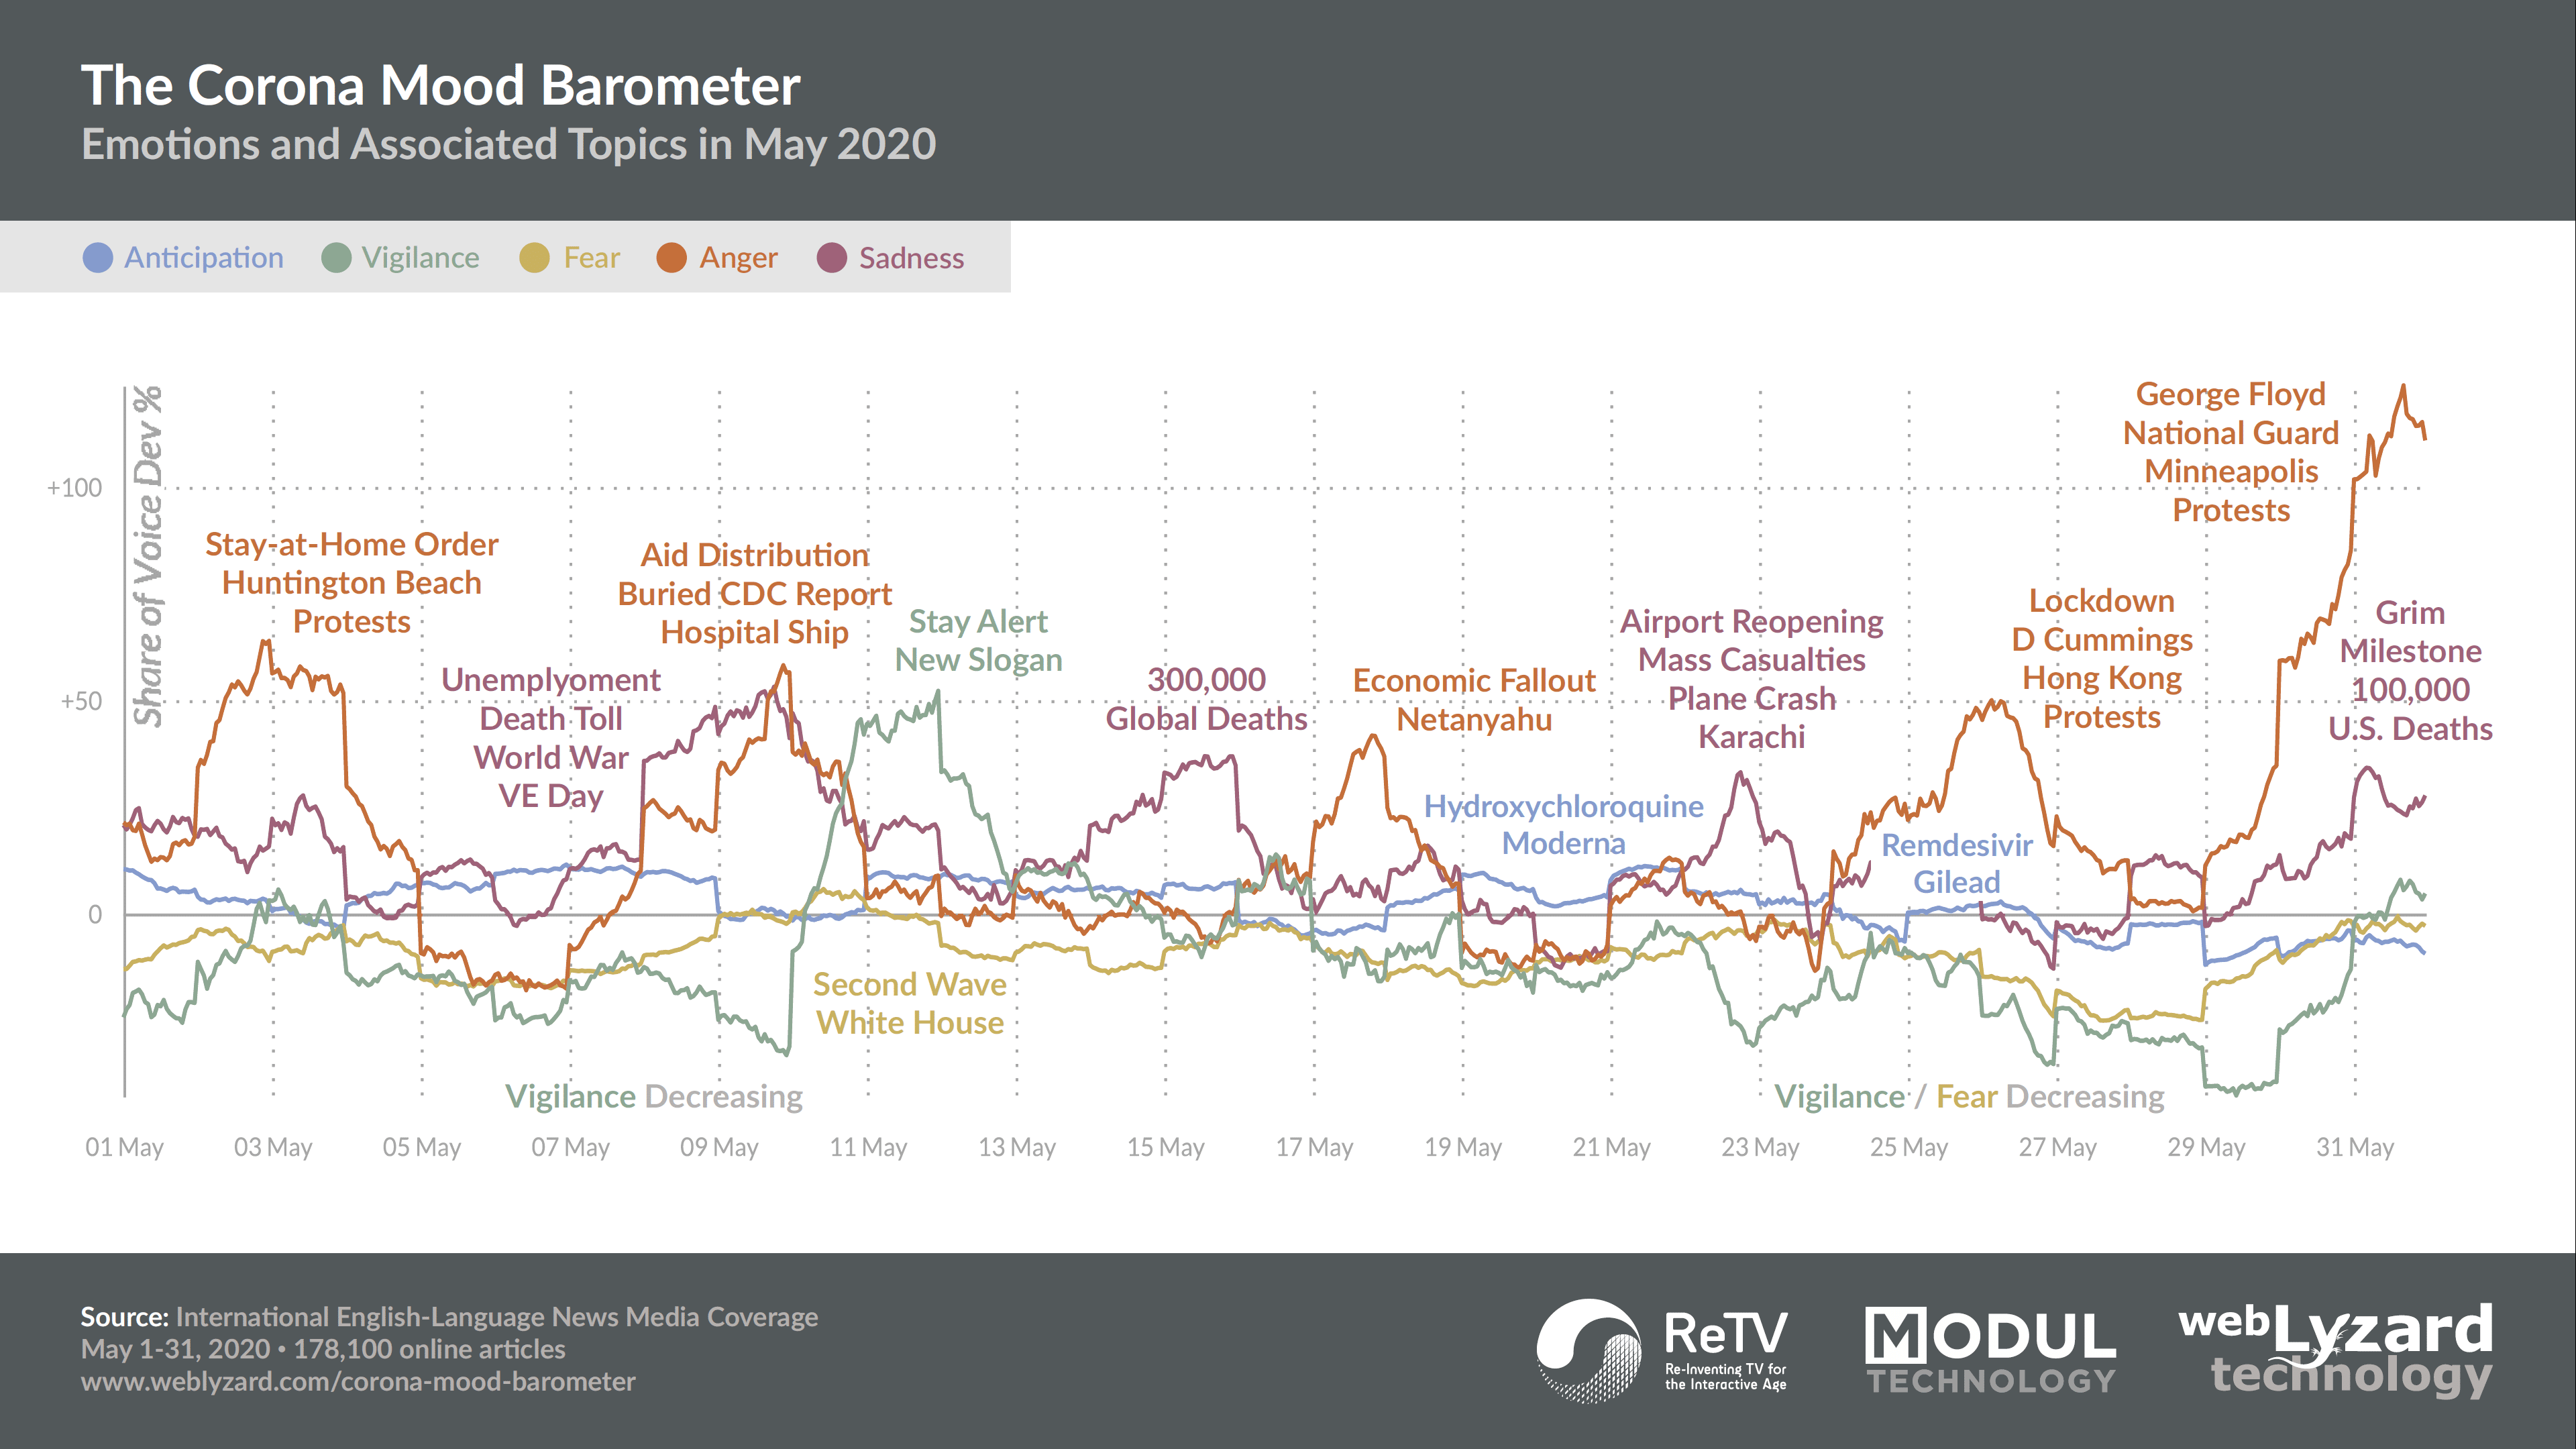
The trend chart plots mood deviations from the average since China reported the first cases among the residents of Wuhan City. The system measures mood in hourly intervals, with a 24-hour moving average to smooth the trend line. The low fluctuations in Fear and Anticipation indicate that these emotions already had a strong presence in the first quarter of 2020:
- “Anticipation” reflects the global race for effective COVID-19 treatment options such as Remdesivir, or vaccine candidates such as Moderna’s mRNA-1273.
- “Vigilance” shows phases of slow decline, interrupted by official interventions. In the case of the changed UK government slogan “Stay Alert”, for example, or during the mass protests in the US, some emotions show a strong increase.
- “Fear” remains on a rather constant level, with notable increases in mid-May. This is when discussions about a second wave intensified and White House officials tested positive for coronavirus. Many also feared increased transmission during mass protests.
- “Anger” exhibits pronounced peaks. Initially, people disagreed with stay-at-home orders. The management of the pandemic by governments and health organizations such as the CDC are additional emotion targets. In the UK, the breaking of lockdown rules by Dominic Cummings, chief adviser to prime minister Boris Johnson, incited public anger.
- “Sadness” increased during the 75th anniversary of VE Day. This coincided with the US unemployment rate being at the highest level since the Great Depression. Further peaks relate to the grim milestones of 300,000 global COVID-related deaths (May 14) and 100,000 in the US (May 27).
Drivers of the Global COVID-19 Debate
Visual tools help to explore the associations with each of the listed emotions. They reveal what drives the public debate. The tag cloud, for example, sorts major associations alphabetically. It also color codes them by emotion. The radar chart projects the top keywords along the chart’s multiple axes. Its radial layout reveals the relative strength of association with each emotional category. The keyword graph, by contrast, applies a hierarchical layout. The grey nodes in the center represent keywords linked to multiple emotional categories.


“Topics Compass” – Corona Mood Dashboard
All of the above visual tools are brought together as part of the Topics Compass dashboard. The underlying algorithms are jointly developed with MODUL Technology as part of the research projects ReTV (“Re-Inventing TV for the Interactive Age”) and EVOLVE (“Leading the Big Data Revolution”). Both are funded by the European Union’s Horizon 2020 Programme.
In addition to the presented international results, the platform has previously been used to analyze the public debate in Austria – in collaboration with the communications consultancy Ketchum Publico in the research project EPOCH (funded by the Austrian Federal Ministry on Climate Action, Environment, Energy, Mobility, Innovation and Technology). Whereas the conversation in Austria has also focused on policies, the appropriateness of measures and police enforcement of these measures, a decreasing number of new infections and the gradual easing of confinement have brought a glimmer of hope and joy.

 Source: CDC