Cluster Map – Search Related Documents
What is a Cluster Map?
Search queries often return an overwhelming number of online documents. A cluster map is an intuitive way to group these search results by topic. By identifying similar documents, it helps to better understand the structure of online coverage and other large document collections. The visual representation of the cluster map arranges documents by their semantic similarity. The system then assigns each document to a specific cluster, which acts as a local gravity point. As a result, the largest node rests at the center and attracts other nodes that belong to this cluster.
Cluster Map Layout
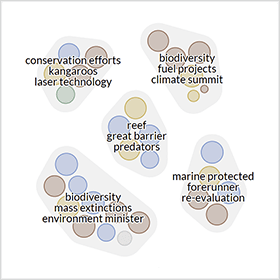
To achieve an appealing and easy to read display, the visualization combines clustering methods with a force-directed layout algorithm. It then highlights groups of similar documents by a convex hull shape that visually holds its nodes together. The size of this shape is dynamic and depends on the number of contained nodes. Each of the nodes, variable in size and color, represents one document:
- Node color reflect the selected metadata attributes. This can be the result of text classification, for example, or extracted affective knowledge such as document sentiment – ranging from red (negative) to grey (neutral) and green (positive). The saturation depends on the degree of polarity. Vivid colors indicate emotional articles, lower saturation a more factual coverage
- Node size is an optional feature of the cluster map. It can indicate the reach of the document’s source, for example. In this case, a node representing CNN.com article is rather large compared to an article of a local community site.
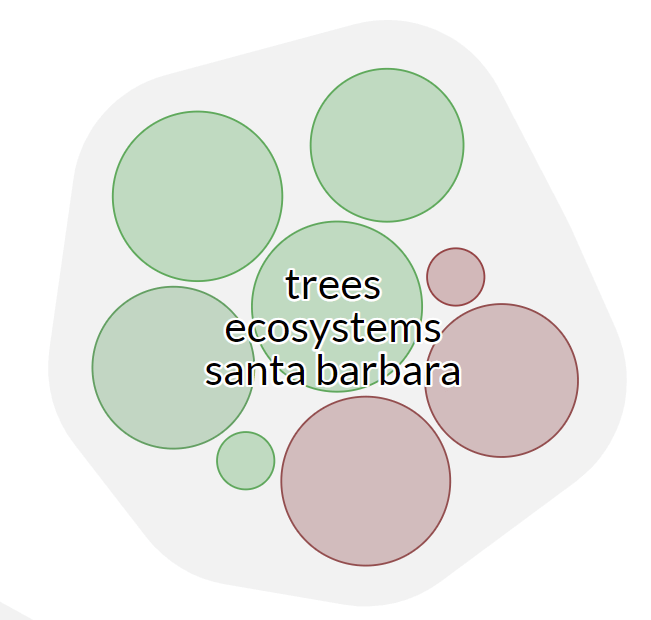
Three keyword labels per cluster describe its contents. Initially, the system computes these labels based on the document keywords within the cluster. This process considers the reach of the documents’ sources to optimize the selection. Reducing the opacity of nodes and their hull shapes increases the label’s readability and reduces the overall visual load.
Interactive Cluster Map Features
- Hovering over a document cluster hides its keywords and highlights its shape and nodes through higher opacity. The colors of its nodes become more vivid.
- Clicking on a cluster triggers a new search, narrowing down the set of results to documents within the selected cluster.
- Hovering over a single node highlights this node with an orange stroke. Additionally, a tooltip shows document keywords and the favicon of the source.
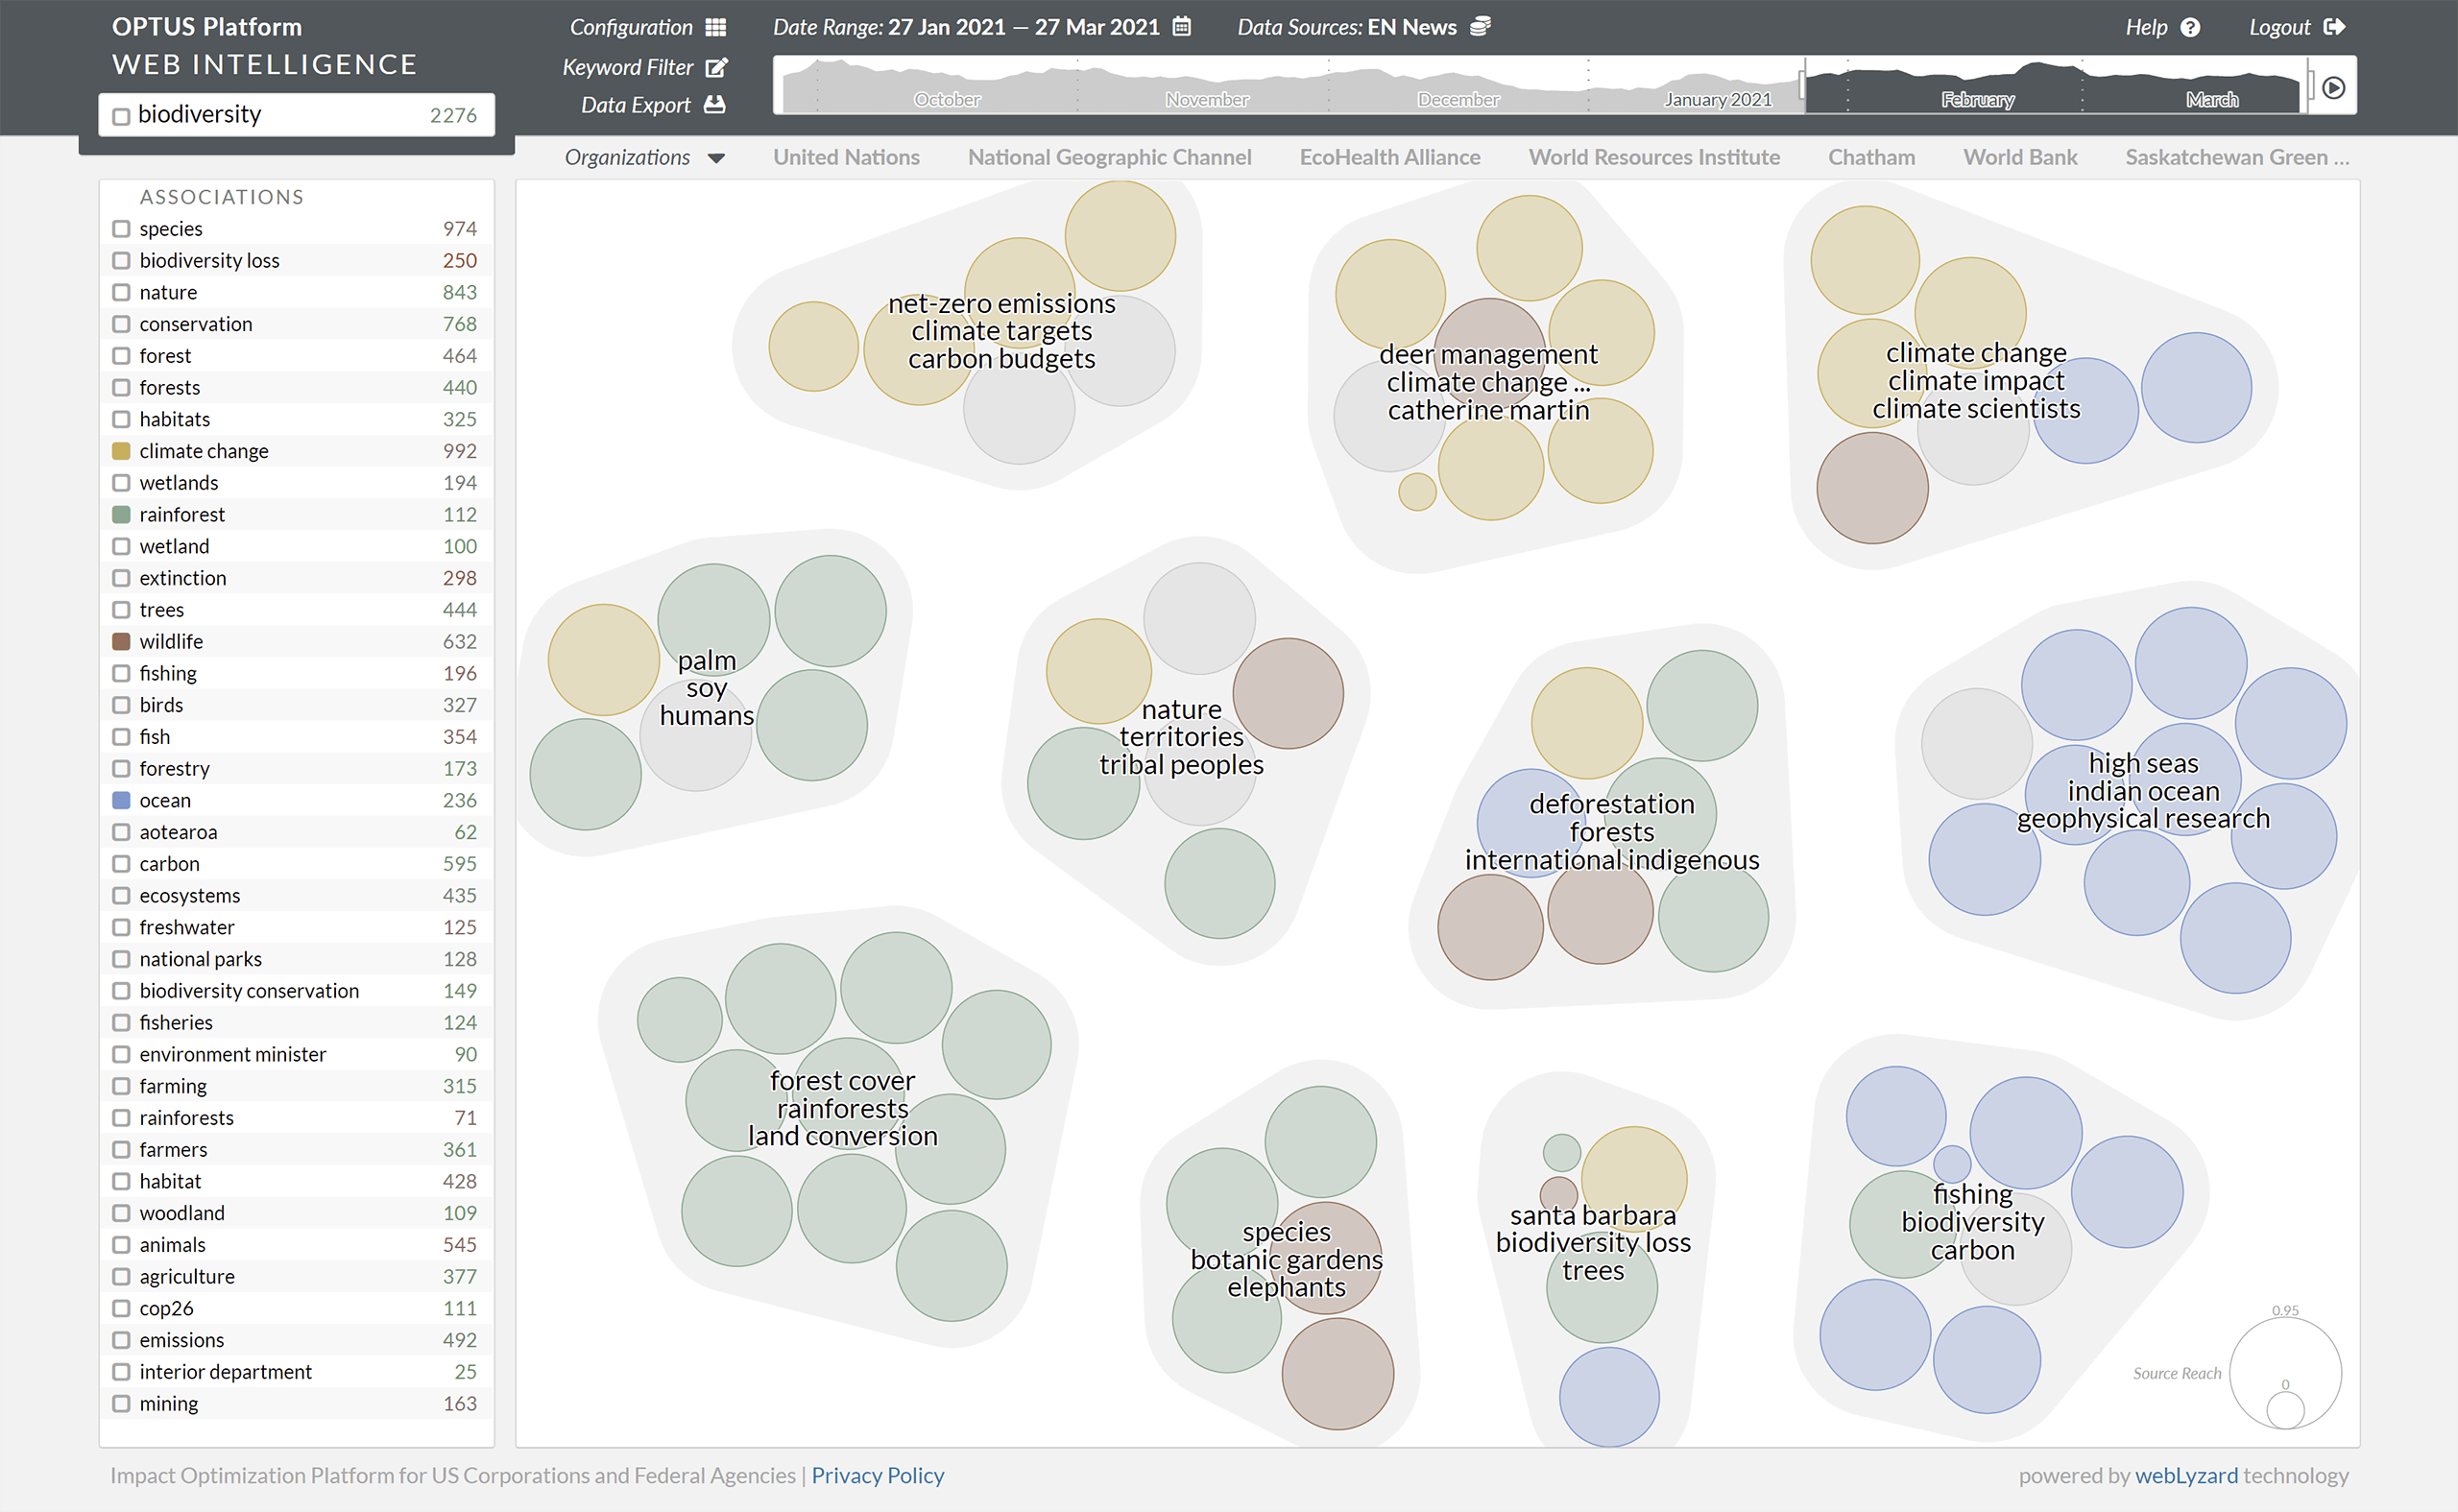
Cluster Map based on the search term biodiversity, color-coded by sub-topic: climate change, rainforest, wildlife and ocean
Clustering Process
Keyword clustering tools have to balance accuracy and scalability. Common methods to build such tools include the Louvain method for community detection as well as K-means, which divides the collection of documents into a fixed amount of clusters. Each document belongs to the cluster with the nearest centroid. The story detection algorithm of webLyzard pursues a similar approach. It uses time slices to extract keywords and is particularly suited for the real-time clustering of very large document collections.
References
- Jain, A.K. (2010). Data Clustering: 50 Years Beyond K-means, Pattern Recognition Letters, 31(8): 651-666.
- Syed, K.A.A., Kröll, M., Sabol, V., Scharl, A. and Gindl, S. (2012). Incremental and Scalable Computation of Dynamic Topography Information Landscapes, Journal of Multimedia Processing and Technologies, 3(1): 49-65.
