
• Link to LinkedIn
  • Link to X
  • Link to Facebook
  • Link to Youtube
  • Link to Mail
Web Intelligence and Visual Analytics
webLyzard technology
  • Home
  • Solutions
    • Product Portfolio
    • Technology Showcases
  • Platform
    • Dashboard Overview
    • Visualization Tools
    • Data Services
  • Research
    • Research Projects
    • Horizon Europe Funding
    • Horizon Europe Dissemination
    • Publications
  • News
    • Latest Updates
    • Release History
    • Newsletter
  • About
    • Contact Details
    • Partners and Clients
    • Privacy Policy
  • Menu Menu
cross media scatterplot

Cross Media Analysis

Comparative analyses of patterns and trends across sources shed light on the editorial position of news media, and the diverging perceptions of e.g. corporations and social media users. The webLyzard cross media analysis package consists of three major components: source selector, source list and source map.

Source Selector

Enables users to retrieve and visualize information from specific stakeholders or media channels, using the “Content Source” menu of the main header to select and deselect sources at any time during the analysis.

Source List

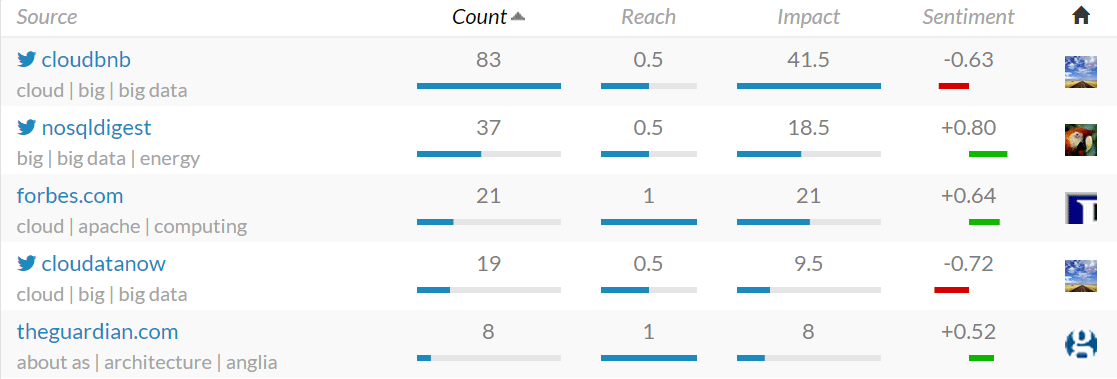
Accessible via the sidebar menu of the search results window, this summary table lists term occurrences by source. The table offers an aggregated view that groups the results by source category (e.g. news versus social media), and a detailed view to compare Web sites such as Forbes or the Guardian, or individual social media accounts. source-list-bigdata The Source List helps identify the most critical and positive voices. It also yields source-specific keywords that reflect what each source associates with the query term. The list can be sorted by name, frequency of mentions (count), reach based on a site’s average traffic rank, impact (frequency multiplied by reach), or average sentiment.
Source Map

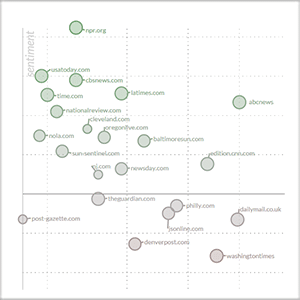
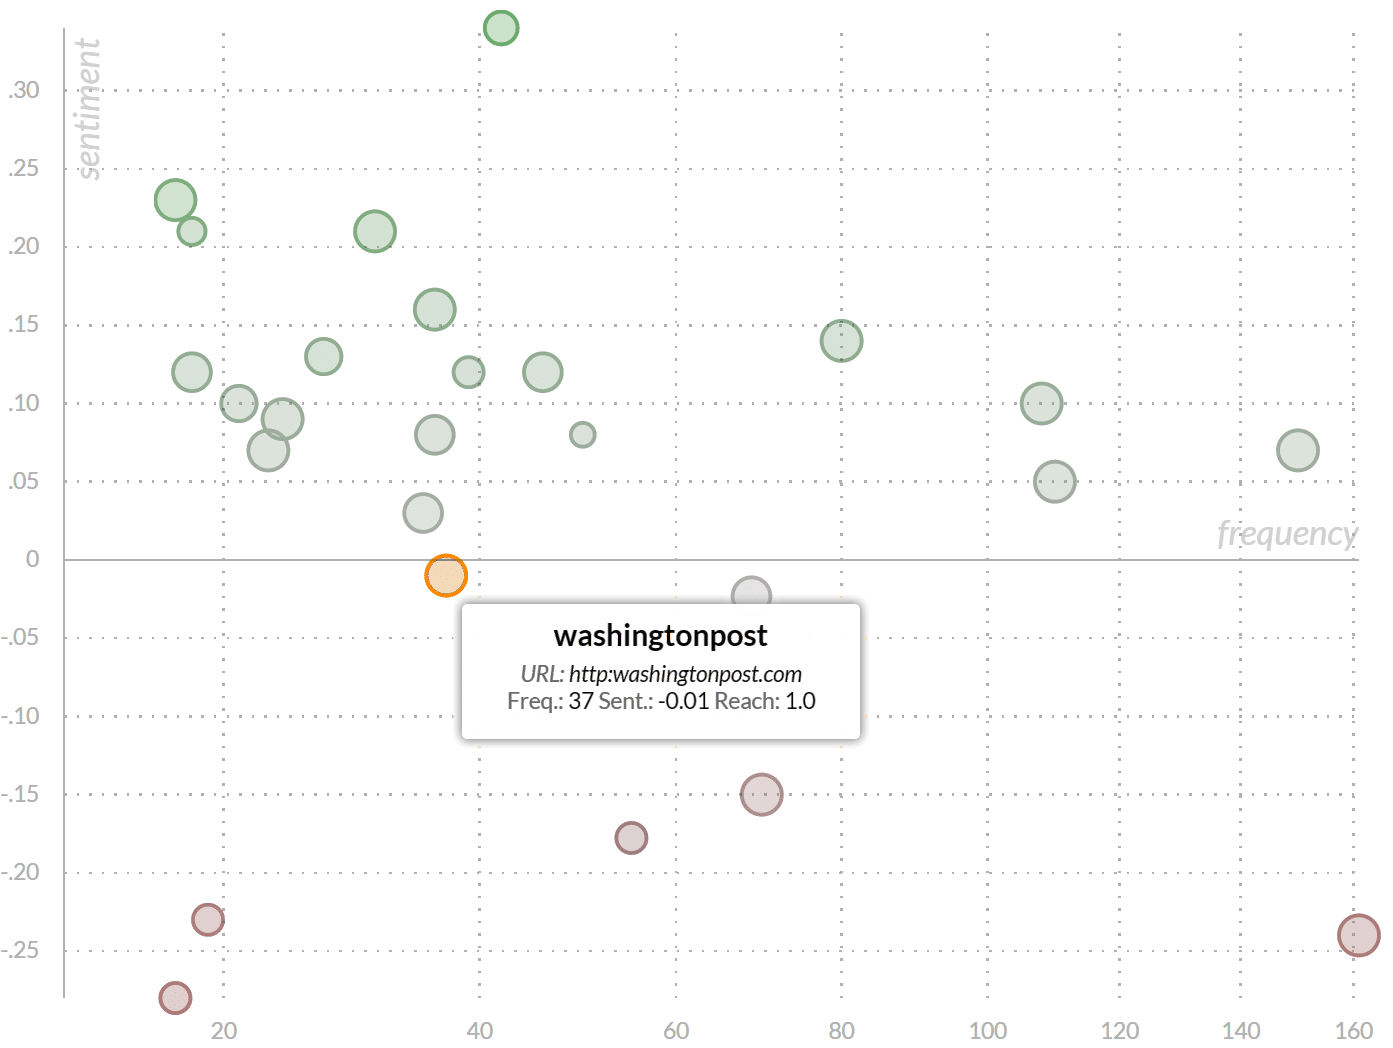
This interactive scatter plot translates the Source List into a visual cross media analysis. It shows the relative importance of a given topic, and the editorial position of the various sources towards this topic. The data points of the scatter plot reflect the following source characteristics:

  • topic frequency (horizontal axis),
  • average sentiment towards the topic (vertical axis, color-coding), and
  • reach of the source (size of the marker).

Data point labels can be activated via the sidebar menu on the left. Whenever a user triggers a new search, animated transitions show the resulting changes in the data point distribution. Cross Media Analysis via a Scatter Plot
Last major update with release 2017-03 (Mangrove Monitor).
https://www.weblyzard.com/data/sites/21/cross-media-scatterplot.png 300 300 Arno Scharl https://www.weblyzard.com/data/sites/21/weblyzard-logo-2020.png Arno Scharl2015-09-01 11:00:132020-11-28 22:17:50Cross Media Analysis
Search Search

CATEGORIES

  • News & Events
  • Use Cases
  • Data Services
  • Visualizations
  • Research Projects

Recent Updates

  • AI Visibility Tracking – Monitoring Generative Engine ResultsJanuary 19, 2026 - 5:14 am
  • TRANSMIXR Presentation at IBC 2025 - Newsroom AI Toolbox
    Newsroom of the Future at IBC 2025September 29, 2025 - 9:42 pm
  • Sustainability Reporting with Generative AIJuly 20, 2025 - 11:59 am
  • CLAIM Project - Thumbnail
    Hybrid AI Models to Detect DisinformationApril 21, 2025 - 9:22 pm
  • Generative AI (GenAI) Thumbnail
    Generative AI for Content LifecyclesMarch 18, 2025 - 8:22 pm

About

webLyzard technology is an Austrian SME founded in 2008. The unique capabilities of its big data platform are based on a strong R&D track record in the fields of knowledge extraction, artificial intelligence, visualization and the integration of geospatial and semantic Web technologies.

web·Lyz·ard

Function: intelligence platform; Etymology: composed from web (as in World Wide Web) and lyzard (as in analyzer). 1 : (broadly) enriches digital content; identified by its speed, accuracy and scalability. 2 : predicts trends to gain a deeper understanding of information flows.

Visual Tools

  • Trend Chart Thumbnail
    Trend Chart – Dynamic Content MetricsOctober 18, 2020 - 9:00 am
  • Story Graph / Streamgraph Thumbnail
    Story Detection and Story Graph VisualizationApril 10, 2020 - 9:02 am
  • Geographic Map of Europe
    Geographic Map – Geospatial AnalyticsOctober 18, 2019 - 11:15 am

Data Services

  • AI Visibility Tracking – Monitoring Generative Engine ResultsJanuary 19, 2026 - 5:14 am
  • Wildcard Search and Regular Expressions
    Wildcard Search and Regular ExpressionsJanuary 9, 2025 - 4:46 am
  • Knowledge Graph - SKB - Thumbnail
    Knowledge Graph – Semantic Knowledge BaseNovember 28, 2024 - 10:00 am
Link to: Topic Wizard – Visual RegExp Editor Link to: Topic Wizard – Visual RegExp Editor Topic Wizard – Visual RegExp EditorTopic Wizard IconLink to: Social Network Analysis (SNA) Link to: Social Network Analysis (SNA) Thumbnail / Social Network Analysis (SNA)Social Network Analysis (SNA)
Scroll to top Scroll to top Scroll to top