Social Network Analysis (SNA)
The analytic framework of webLyzard uses automated content analysis to reveal keyword associations, identify positive or negative sentiment in stakeholder communication, and compute success metrics to assess the impact of communication campaigns. The Social Network Analysis component significantly extends this analytic framework by not only visualizing what is being communicated, but also who is driving the public debate.
What is Social Network Analysis?
Social Network Analysis (SNA) investigates complex interactions between people, groups and organizations – for example, events that trigger the rapid spread of emerging stories in social media. The visual tools of webLyzard help to track such information diffusion process and assess the impact of events.
How to Render the Network Graph
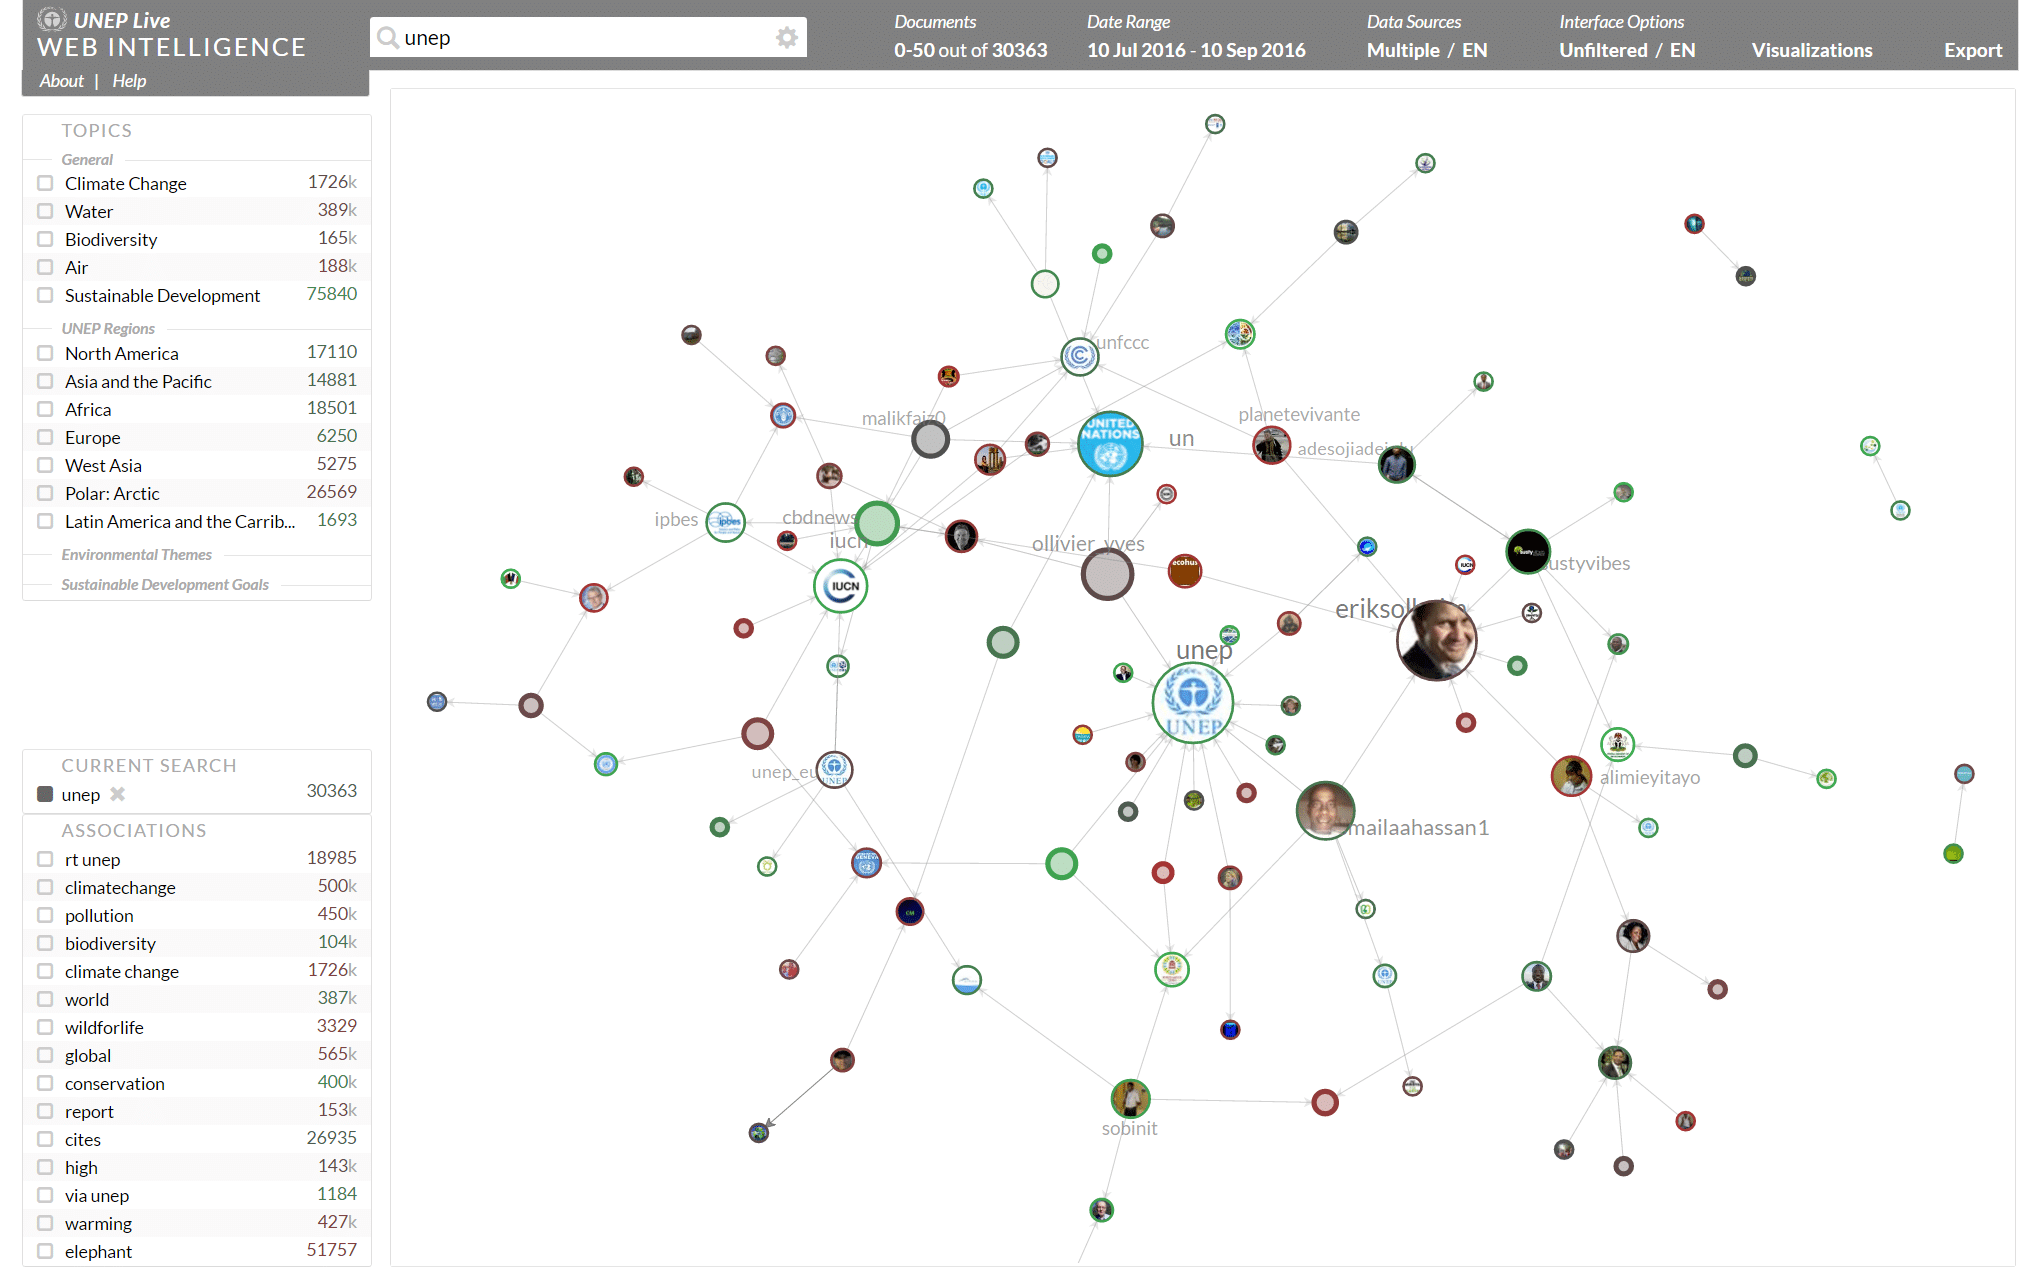
The nodes of the graph show Twitter authors with the highest number of relevant postings – see screenshot below, which stems from the UNEP Live Web Intelligence portal. The (directed) edges of the graph indicate “@” references to other Twitter accounts. The rendering of the graph follows a three-step process:
Clustering. Initially, the system identifies a predefined number of top authors. The number of authors to identify can be specified in the floating menu on the left.
Pattern Identification. In a second step, links are established to highlight those authors who participated in a conversation. The algorithm disregards those that merely published on the topic, but did not engage in a dialogue with other authors.
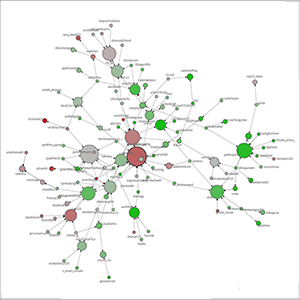
Layout. Finally, force-directed placement algorithms in conjunction with collision detection optimize the graph layout. The size of the nodes varies according to the selected network metric – e.g., betweenness centrality (see below).
Social Network Analysis Features
Metadata Display
Node Color shows the average sentiment of all postings of a Twitter user that match the search query in the selected time interval.
Node size reflects the relative importance in the public dialogue about the selected topic. The floating menu offers four different centrality measures:
- In-Degree Centrality. Number of incoming links, indicating how many others are mentioning this node (= default metric).
- Out-Degree Centrality. Number of outgoing links, which shows the number of references to other nodes.
- Betweenness Centrality. Number of shortest paths that go through a node. This reflects the node’s role as a communication hub in the network structure.
- Eigenvector Centrality. The importance of a node is determined by the importance of its neighbors. Eigenvector centrality resembles Google’s PageRank algorithm.
Interactive Display Features
Tooltips. Hovering over a node emphasizes its outgoing links and shows a tooltip with additional information about the Twitter account. This includes user name, number of relevant tweets about the topic, and the average sentiment of the tweets.
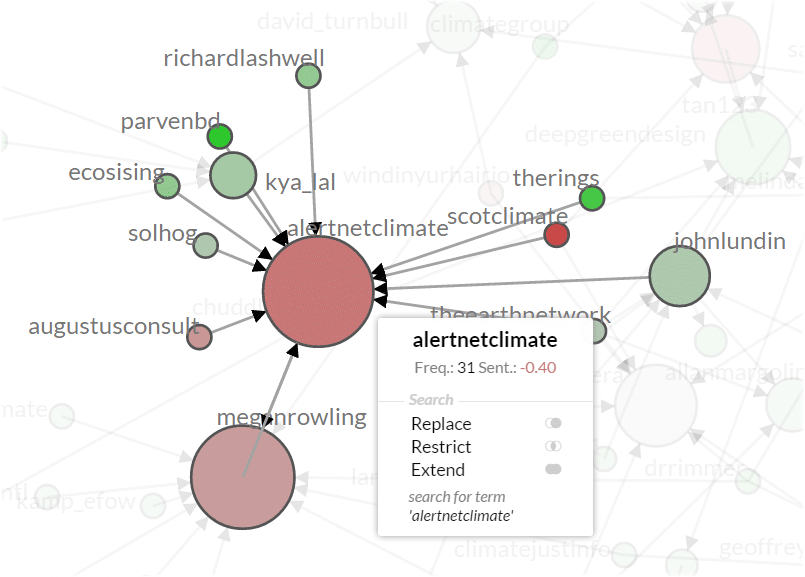 Highlight Mode. Clicking on a node greys out the rest of the network and expands the tooltip with three search options (replace, restrict, expand). A single click on additional nodes adds them to the highlighted part of the network. A double click disables highlight mode and restores the whole network structure.
Zoom Operations are triggered either via the mouse wheel, or by double clicking a node when the graph is not in highlight mode.
Node Positioning. With the exception of the root node in the center of the window, users can drag and drop individual nodes to different positions. The “freeze” button in the upper right corner deactivates the graph’s adaptive layout process.
Last major update with release 2016-06 (Komodo Dragon).
