
• Link to LinkedIn
  • Link to X
  • Link to Facebook
  • Link to Youtube
  • Link to Mail
Web Intelligence and Visual Analytics
webLyzard technology
  • Home
  • Solutions
    • Product Portfolio
    • Technology Showcases
  • Platform
    • Dashboard Overview
    • Visualization Tools
    • Data Services
  • Research
    • Research Projects
    • Horizon Europe Funding
    • Horizon Europe Dissemination
    • Publications
  • News
    • Latest Updates
    • Release History
    • Newsletter
  • About
    • Contact Details
    • Partners and Clients
    • Privacy Policy
  • Menu Menu
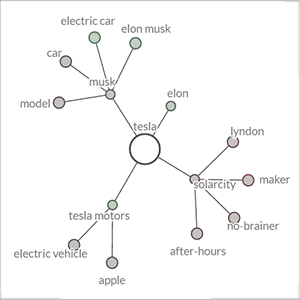
Keyword Graph Thumbnail (Query: Tesla)

Keyword Graph – Semantic Associations

The keyword graph shows the search term together with its strongest associations within the search results. The resulting semantic network is a powerful tool to guide the development and ongoing adaptation of an organization’s communication strategies. The keyword graph allows investigating how different stakeholder groups perceive brands or products, what negative and positive associations they have with a topic (the color of data points encodes their sentiment), and how the meaning of specific terms changes over time.

Semantic Associations

The computation of associations considers the selected source(s) and time interval, and whether the topic comparison or sentiment mode is active. Changing any of these settings, therefore, triggers an immediate update of the graph (which can also be enlarged to full screen size).

Keyword Graph Controls

Additional options to manipulate the graph include:

  • Single clicking on a child node extends the graph with up to eight new nodes. The ‘+’ symbol in the upper right corner triggers this process for each of the displayed child nodes, thereby showing the next hierarchical level in its entirety.
  • Single clicking on a parent node deletes all its child nodes, which allows filtering out unwanted sub-trees.
  • Double clicking on any of the displayed nodes triggers a search for the keyword.
  • ‘Edges’ refers to the number of connections to be considered when adding new elements to the graph. The default value is five, which can be increased up to a maximum of eight connections.
  • Clicking on the central term (= root node) resets the diagram.
  • The ‘pause’ button freezes the display, allowing the analyst to manually re-arrange the position of nodes via drag and drop operations.
https://www.weblyzard.com/data/sites/21/keyword-graph-300.png 300 300 Arno Scharl https://www.weblyzard.com/data/sites/21/weblyzard-logo-2020.png Arno Scharl2010-12-02 16:31:242021-05-08 17:47:43Keyword Graph – Semantic Associations
Search Search

CATEGORIES

  • News & Events
  • Use Cases
  • Data Services
  • Visualizations
  • Research Projects

Recent Updates

  • AI Visibility Tracking – Monitoring Generative Engine ResultsJanuary 19, 2026 - 5:14 am
  • TRANSMIXR Presentation at IBC 2025 - Newsroom AI Toolbox
    Newsroom of the Future at IBC 2025September 29, 2025 - 9:42 pm
  • Sustainability Reporting with Generative AIJuly 20, 2025 - 11:59 am
  • CLAIM Project - Thumbnail
    Hybrid AI Models to Detect DisinformationApril 21, 2025 - 9:22 pm
  • Generative AI (GenAI) Thumbnail
    Generative AI for Content LifecyclesMarch 18, 2025 - 8:22 pm

About

webLyzard technology is an Austrian SME founded in 2008. The unique capabilities of its big data platform are based on a strong R&D track record in the fields of knowledge extraction, artificial intelligence, visualization and the integration of geospatial and semantic Web technologies.

web·Lyz·ard

Function: intelligence platform; Etymology: composed from web (as in World Wide Web) and lyzard (as in analyzer). 1 : (broadly) enriches digital content; identified by its speed, accuracy and scalability. 2 : predicts trends to gain a deeper understanding of information flows.

Visual Tools

  • Trend Chart Thumbnail
    Trend Chart – Dynamic Content MetricsOctober 18, 2020 - 9:00 am
  • Story Graph / Streamgraph Thumbnail
    Story Detection and Story Graph VisualizationApril 10, 2020 - 9:02 am
  • Geographic Map of Europe
    Geographic Map – Geospatial AnalyticsOctober 18, 2019 - 11:15 am

Data Services

  • AI Visibility Tracking – Monitoring Generative Engine ResultsJanuary 19, 2026 - 5:14 am
  • Wildcard Search and Regular Expressions
    Wildcard Search and Regular ExpressionsJanuary 9, 2025 - 4:46 am
  • Knowledge Graph - SKB - Thumbnail
    Knowledge Graph – Semantic Knowledge BaseNovember 28, 2024 - 10:00 am
Link to: Ontology Graph and Domain Model Link to: Ontology Graph and Domain Model Ontology Graph and Domain ModelOntology Graph ThumbnailLink to: Information Landscape Link to: Information Landscape Information Landscape ThumbnailInformation Landscape
Scroll to top Scroll to top Scroll to top