• Link to LinkedIn
  • Link to X
  • Link to Facebook
  • Link to Youtube
  • Link to Mail
Web Intelligence and Visual Analytics
webLyzard technology
  • Home
  • Solutions
    • Product Portfolio
    • Technology Showcases
  • Platform
    • Dashboard Overview
    • Visualization Tools
    • Data Services
  • Research
    • Research Projects
    • Horizon Europe Funding
    • Horizon Europe Dissemination
    • Publications
  • News
    • Latest Updates
    • Release History
    • Newsletter
  • About
    • Contact Details
    • Partners and Clients
    • Privacy Policy
  • Menu Menu
Story Graph / Streamgraph Thumbnail

Story Detection and Story Graph Visualization

Story Detection identifies and describes groups of related documents (= stories) from digital content streams. For each story, we extract a rich set of metadata. This includes the origin of the story in terms of publication time and author. We then evaluate the impact of the story by analyzing the temporal distribution of related publications. This analysis also helps to identify the best keywords to summarize the content of a story. As a final step, we visualize the results by creating an interactive Story Graph.

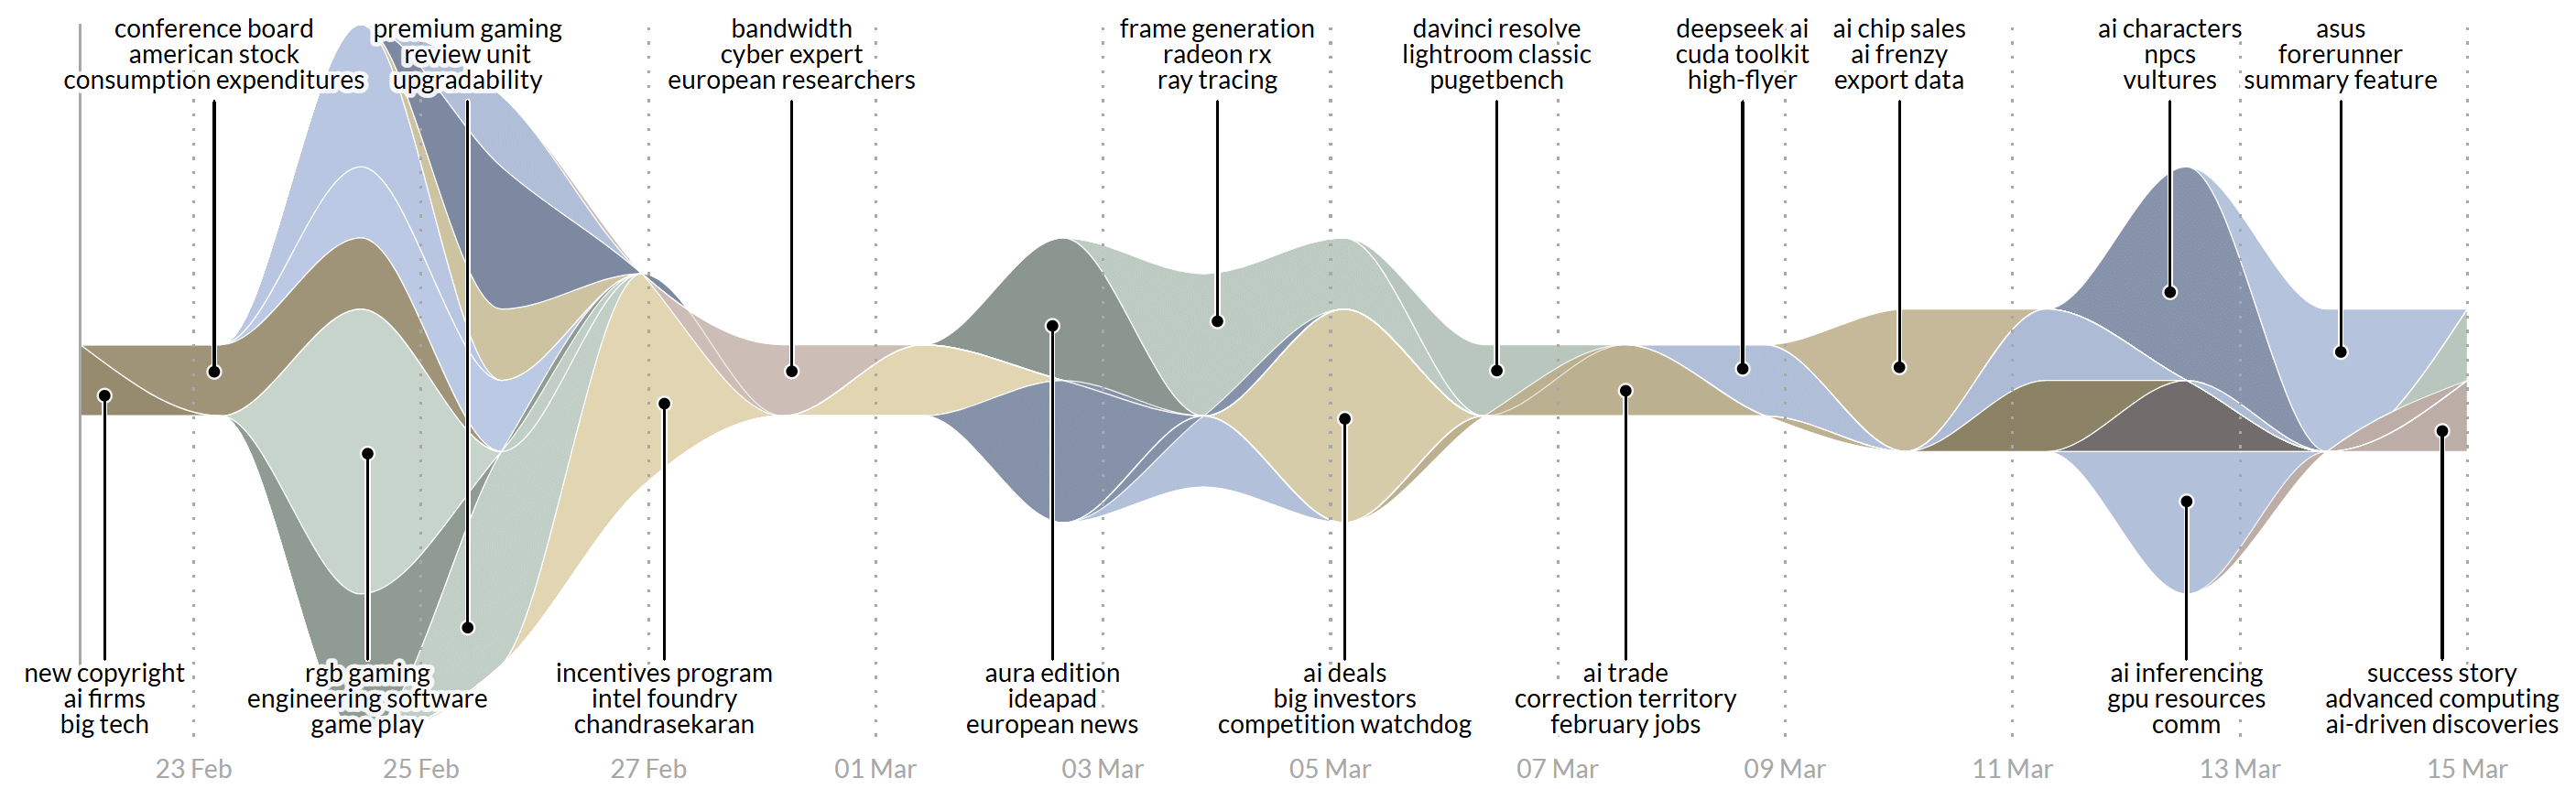
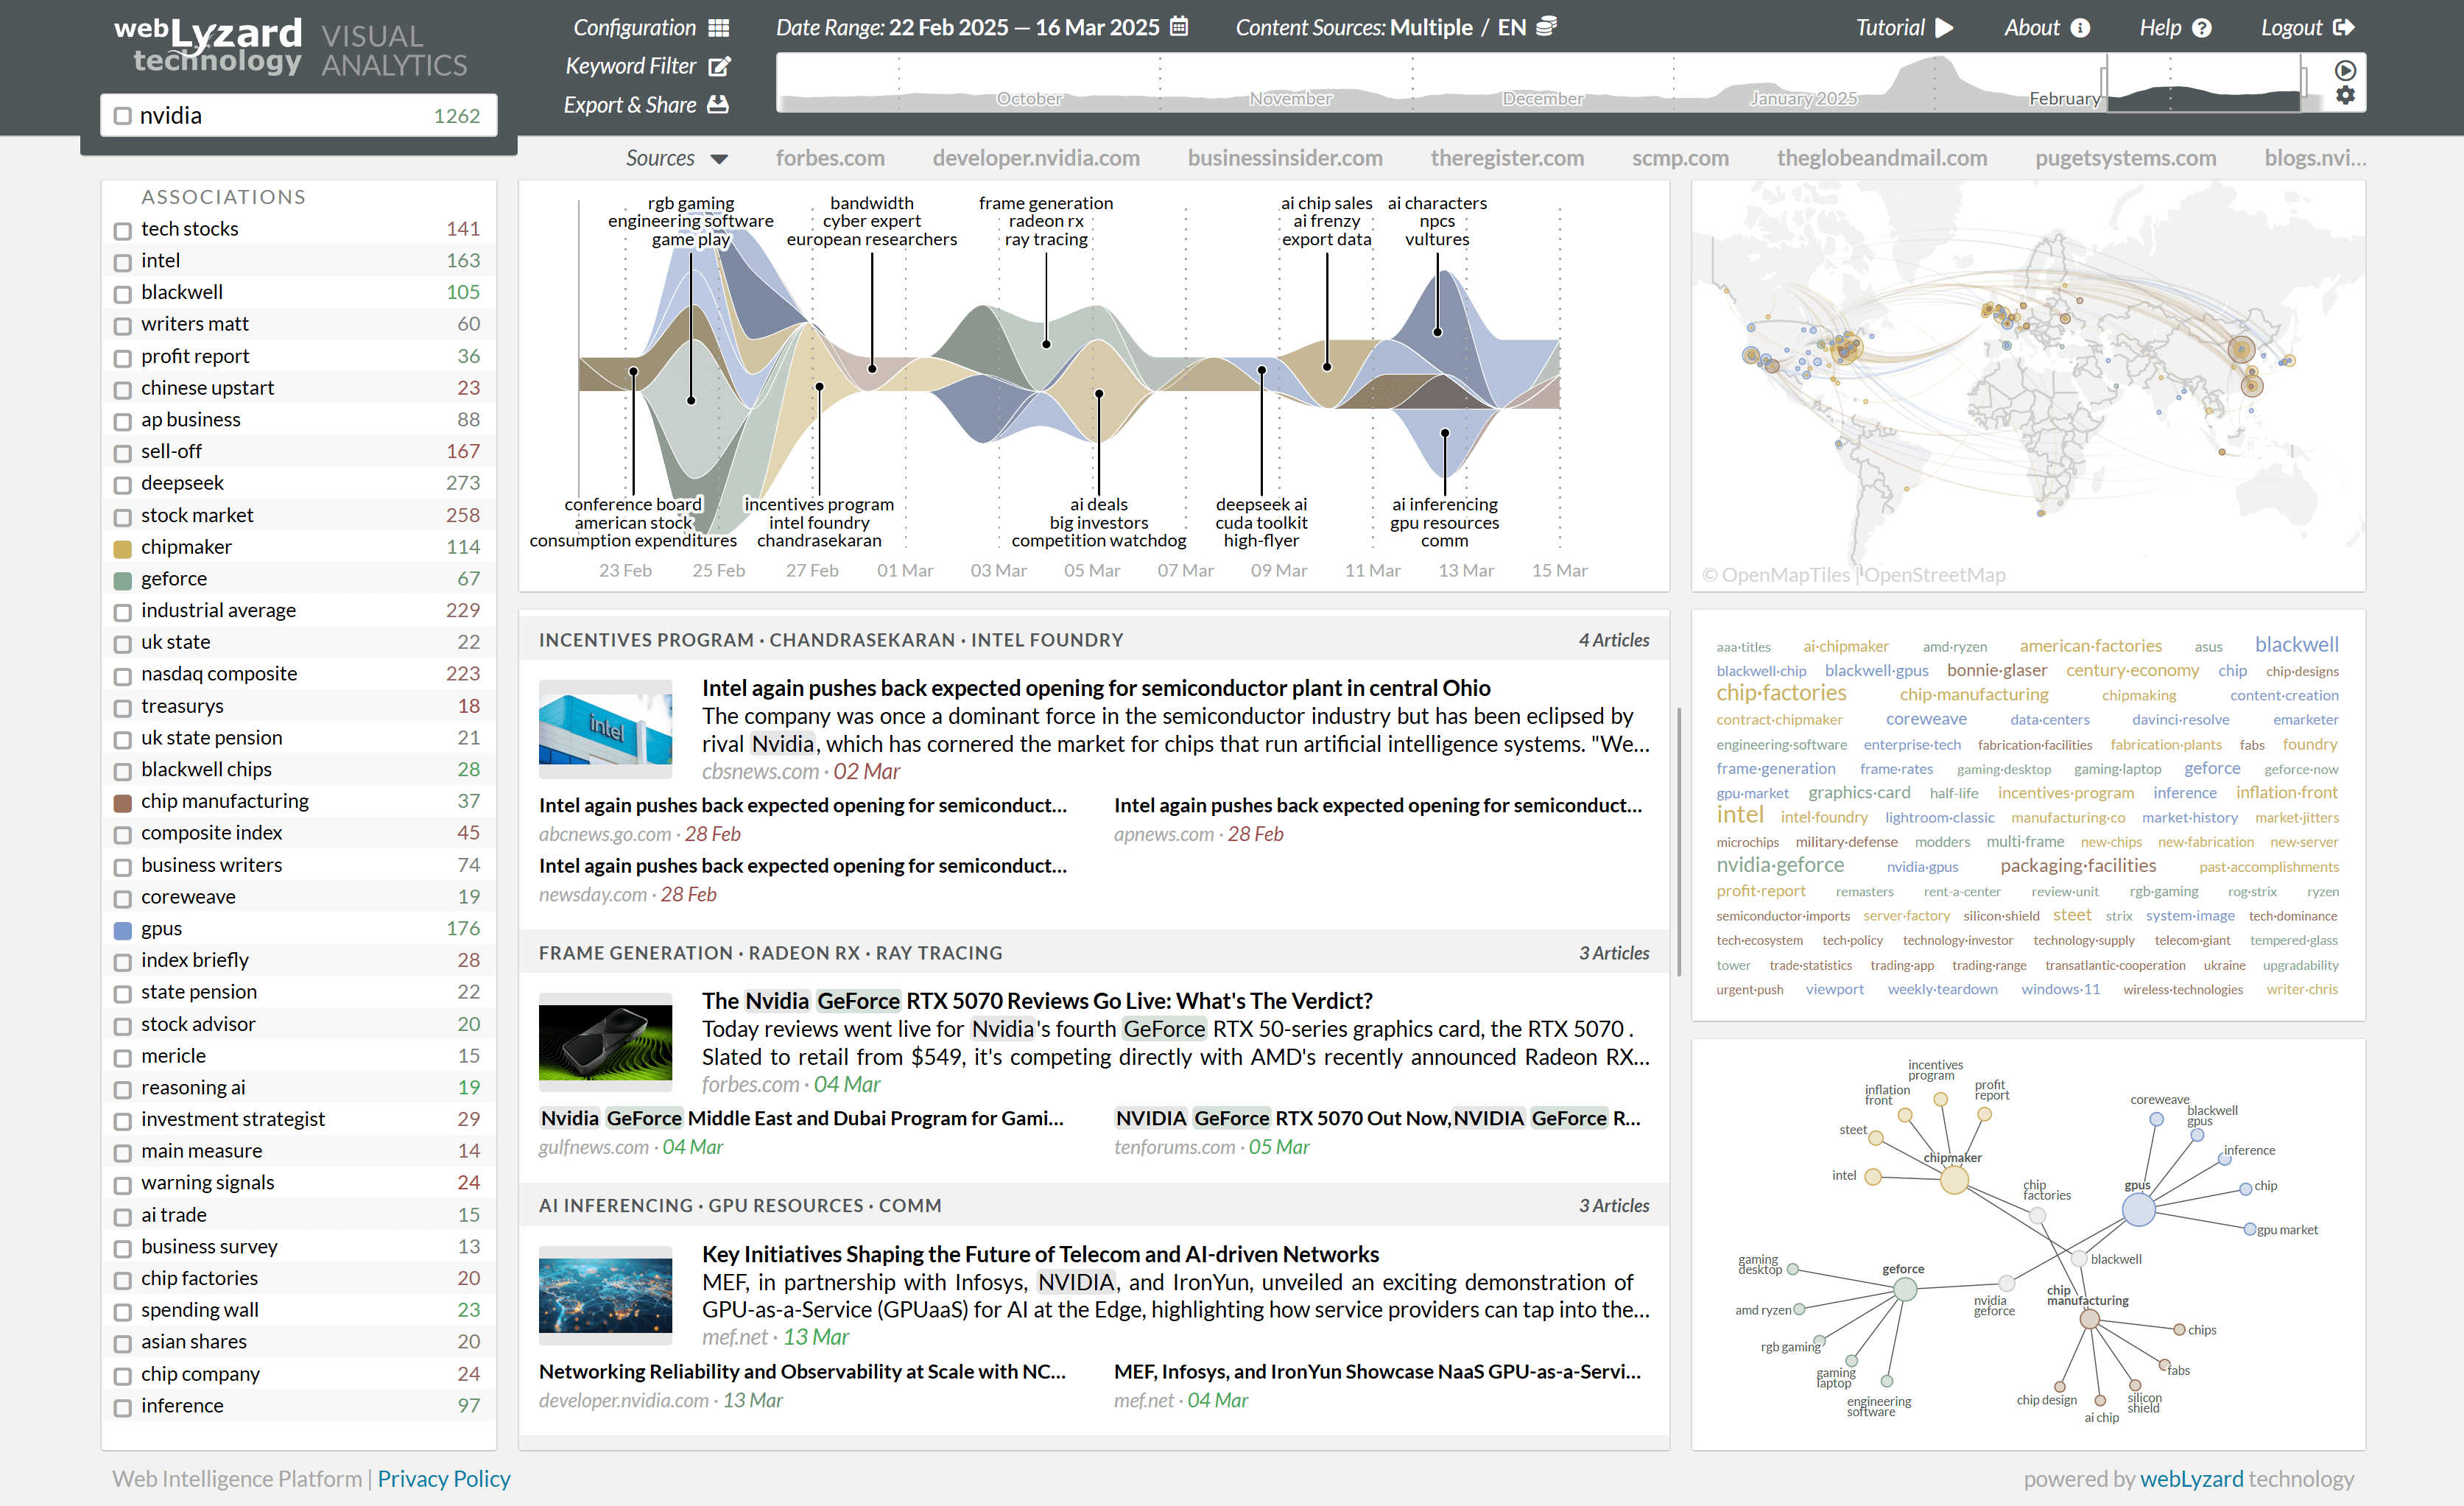
The following Story Graph illustrates this process using a query on “Nvidia”. The screenshot at the end of this article shows the Story Graph together with a list of top stories. For each story, this list includes a headline with the keywords and size of the cluster. Below the headline, a lead article and a list of related documents allow you to quickly understand the main aspects of the story.

Story Graph Visualization | Nvidia, Streamgraph

Clustering Digital Content Streams

The story detection component uses scalable methods to cluster documents in real time. These methods work with multiple content sources and languages. At the moment, the system supports English, Spanish, French, German, Dutch, Czech, Italian and Portuguese documents. Three keywords per cluster serve as a label to describe its contents. The methods to create these labels are not only multilingual, they are also effective dealing with noisy data. Examples for such noisy data include social media postings or results from speech-to-text conversion. Moreover, the clustering produces high-quality results even when applied to documents of very different structure and length.

Interactive Controls of the Story Graph

Story Graph Representation

  • Tooltips. Hovering a story indicates its duration and the number of documents that belong to this story. Users can use the tooltip to either focus on this story, or exclude it from the query. Below, the tooltip shows the associated keywords. A synchronization mechanism automatically highlights the corresponding story in the Story View.
  • Settings. The settings icon in the upper right corner provides various options to finetune the display of the graph. You can turn on and off the labels, for example, or select the metric to be used (document count or weight). Additional, it is possible to determine how the system should stack (silhouette, expand, zero, wiggle) and sort (default, inside-out, reverse) the stories.

Story Detection Result List

  • Clicking on the title or snippet of an article activates its full-text view.
  • Clicking on the name of the source opens a separate window with the original article or posting.
  • The number of articles in the grey headline triggers a search for those articles. The arrow down expands the list of shown articles.

webLyzard Dashboard - Chipmaker Nvidia, GPUs

Last major update with release 2024-12 (Veiled Chameleon).

https://www.weblyzard.com/data/sites/21/weblyzard-streamgraph.png 280 280 Arno Scharl https://www.weblyzard.com/data/sites/21/weblyzard-logo-2020.png Arno Scharl2020-04-10 09:02:522025-03-19 09:05:25Story Detection and Story Graph Visualization
Search Search

CATEGORIES

  • News & Events
  • Use Cases
  • Data Services
  • Visualizations
  • Research Projects

Recent Updates

  • AI Visibility Tracking – Monitoring Generative Engine ResultsJanuary 19, 2026 - 5:14 am
  • TRANSMIXR Presentation at IBC 2025 - Newsroom AI Toolbox
    Newsroom of the Future at IBC 2025September 29, 2025 - 9:42 pm
  • Sustainability Reporting with Generative AIJuly 20, 2025 - 11:59 am
  • CLAIM Project - Thumbnail
    Hybrid AI Models to Detect DisinformationApril 21, 2025 - 9:22 pm
  • Generative AI (GenAI) Thumbnail
    Generative AI for Content LifecyclesMarch 18, 2025 - 8:22 pm

About

webLyzard technology is an Austrian SME founded in 2008. The unique capabilities of its big data platform are based on a strong R&D track record in the fields of knowledge extraction, artificial intelligence, visualization and the integration of geospatial and semantic Web technologies.

web·Lyz·ard

Function: intelligence platform; Etymology: composed from web (as in World Wide Web) and lyzard (as in analyzer). 1 : (broadly) enriches digital content; identified by its speed, accuracy and scalability. 2 : predicts trends to gain a deeper understanding of information flows.

Visual Tools

  • Trend Chart Thumbnail
    Trend Chart – Dynamic Content MetricsOctober 18, 2020 - 9:00 am
  • Story Graph / Streamgraph Thumbnail
    Story Detection and Story Graph VisualizationApril 10, 2020 - 9:02 am
  • Geographic Map of Europe
    Geographic Map – Geospatial AnalyticsOctober 18, 2019 - 11:15 am

Data Services

  • AI Visibility Tracking – Monitoring Generative Engine ResultsJanuary 19, 2026 - 5:14 am
  • Wildcard Search and Regular Expressions
    Wildcard Search and Regular ExpressionsJanuary 9, 2025 - 4:46 am
  • Knowledge Graph - SKB - Thumbnail
    Knowledge Graph – Semantic Knowledge BaseNovember 28, 2024 - 10:00 am
Link to: inDICEs – Impact of Digital Culture Link to: inDICEs – Impact of Digital Culture inDICEs – Impact of Digital CultureInDICEs Project LogoLink to: CIMPLE – Explainable AI Project Link to: CIMPLE – Explainable AI Project CIMPLE Explainable AI ProjectCIMPLE – Explainable AI Project
Scroll to top Scroll to top Scroll to top