• Link to LinkedIn
  • Link to X
  • Link to Facebook
  • Link to Youtube
  • Link to Mail
Web Intelligence and Visual Analytics
webLyzard technology
  • Home
  • Solutions
    • Product Portfolio
    • Technology Showcases
  • Platform
    • Dashboard Overview
    • Visualization Tools
    • Data Services
  • Research
    • Research Projects
    • Horizon Europe Funding
    • Horizon Europe Dissemination
    • Publications
  • News
    • Latest Updates
    • Release History
    • Newsletter
  • About
    • Contact Details
    • Partners and Clients
    • Privacy Policy
  • Menu Menu
Ontology Graph Thumbnail

Ontology Graph and Domain Model

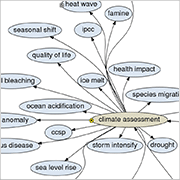
The ontology graph displays a clickable domain model that matches documents and concepts to help users determine their current location in the information space. The ontology graph depicts hierarchical relations as arrows.

Interactive Controls

The currently active document is highlighted by a yellow asterisk, and the letters [1-5] represent the classification of the five highest-ranking documents in the similar locations view. Clicking on a concept activates the highest-ranking document for this particular concept.

https://www.weblyzard.com/data/sites/21/ontology-graph.png 180 180 Arno Scharl https://www.weblyzard.com/data/sites/21/weblyzard-logo-2020.png Arno Scharl2009-12-04 11:39:312020-06-13 10:07:42Ontology Graph and Domain Model
Search Search

CATEGORIES

  • News & Events
  • Use Cases
  • Data Services
  • Visualizations
  • Research Projects

Recent Updates

  • AI Visibility Tracking – Monitoring Generative Engine ResultsJanuary 19, 2026 - 5:14 am
  • TRANSMIXR Presentation at IBC 2025 - Newsroom AI Toolbox
    Newsroom of the Future at IBC 2025September 29, 2025 - 9:42 pm
  • Sustainability Reporting with Generative AIJuly 20, 2025 - 11:59 am
  • CLAIM Project - Thumbnail
    Hybrid AI Models to Detect DisinformationApril 21, 2025 - 9:22 pm
  • Generative AI (GenAI) Thumbnail
    Generative AI for Content LifecyclesMarch 18, 2025 - 8:22 pm

About

webLyzard technology is an Austrian SME founded in 2008. The unique capabilities of its big data platform are based on a strong R&D track record in the fields of knowledge extraction, artificial intelligence, visualization and the integration of geospatial and semantic Web technologies.

web·Lyz·ard

Function: intelligence platform; Etymology: composed from web (as in World Wide Web) and lyzard (as in analyzer). 1 : (broadly) enriches digital content; identified by its speed, accuracy and scalability. 2 : predicts trends to gain a deeper understanding of information flows.

Visual Tools

  • Trend Chart Thumbnail
    Trend Chart – Dynamic Content MetricsOctober 18, 2020 - 9:00 am
  • Story Graph / Streamgraph Thumbnail
    Story Detection and Story Graph VisualizationApril 10, 2020 - 9:02 am
  • Geographic Map of Europe
    Geographic Map – Geospatial AnalyticsOctober 18, 2019 - 11:15 am

Data Services

  • AI Visibility Tracking – Monitoring Generative Engine ResultsJanuary 19, 2026 - 5:14 am
  • Wildcard Search and Regular Expressions
    Wildcard Search and Regular ExpressionsJanuary 9, 2025 - 4:46 am
  • Knowledge Graph - SKB - Thumbnail
    Knowledge Graph – Semantic Knowledge BaseNovember 28, 2024 - 10:00 am
Link to: AVALON Research Project Link to: AVALON Research Project AVALON Research Projectavalon project logoLink to: Keyword Graph – Semantic Associations Link to: Keyword Graph – Semantic Associations Keyword Graph Thumbnail (Query: Tesla)Keyword Graph – Semantic Associations
Scroll to top Scroll to top Scroll to top