
EcoMove Mobility Project
Project Start: 01 July 2018
Consortium: webLyzard technology, MODUL University Vienna, Unwired Networks, NAST Consulting
Funding: Federal Ministry for Transport, Innovation and Technology (bmvit), Mobility of the Future Program
The planning, observation and steering of urban mobility are growing ever more complex due to increasing urban density, varied transport services and rising expectations of city inhabitants and visitors. Integrated information about capacity bottlenecks in the transport infrastructure combined with current and future events is scarce. This results in mobility constraints, capacity overload in current transportation services, and negative social and environmental consequences for the city inhabitants and visitors.
Goals and Use Case
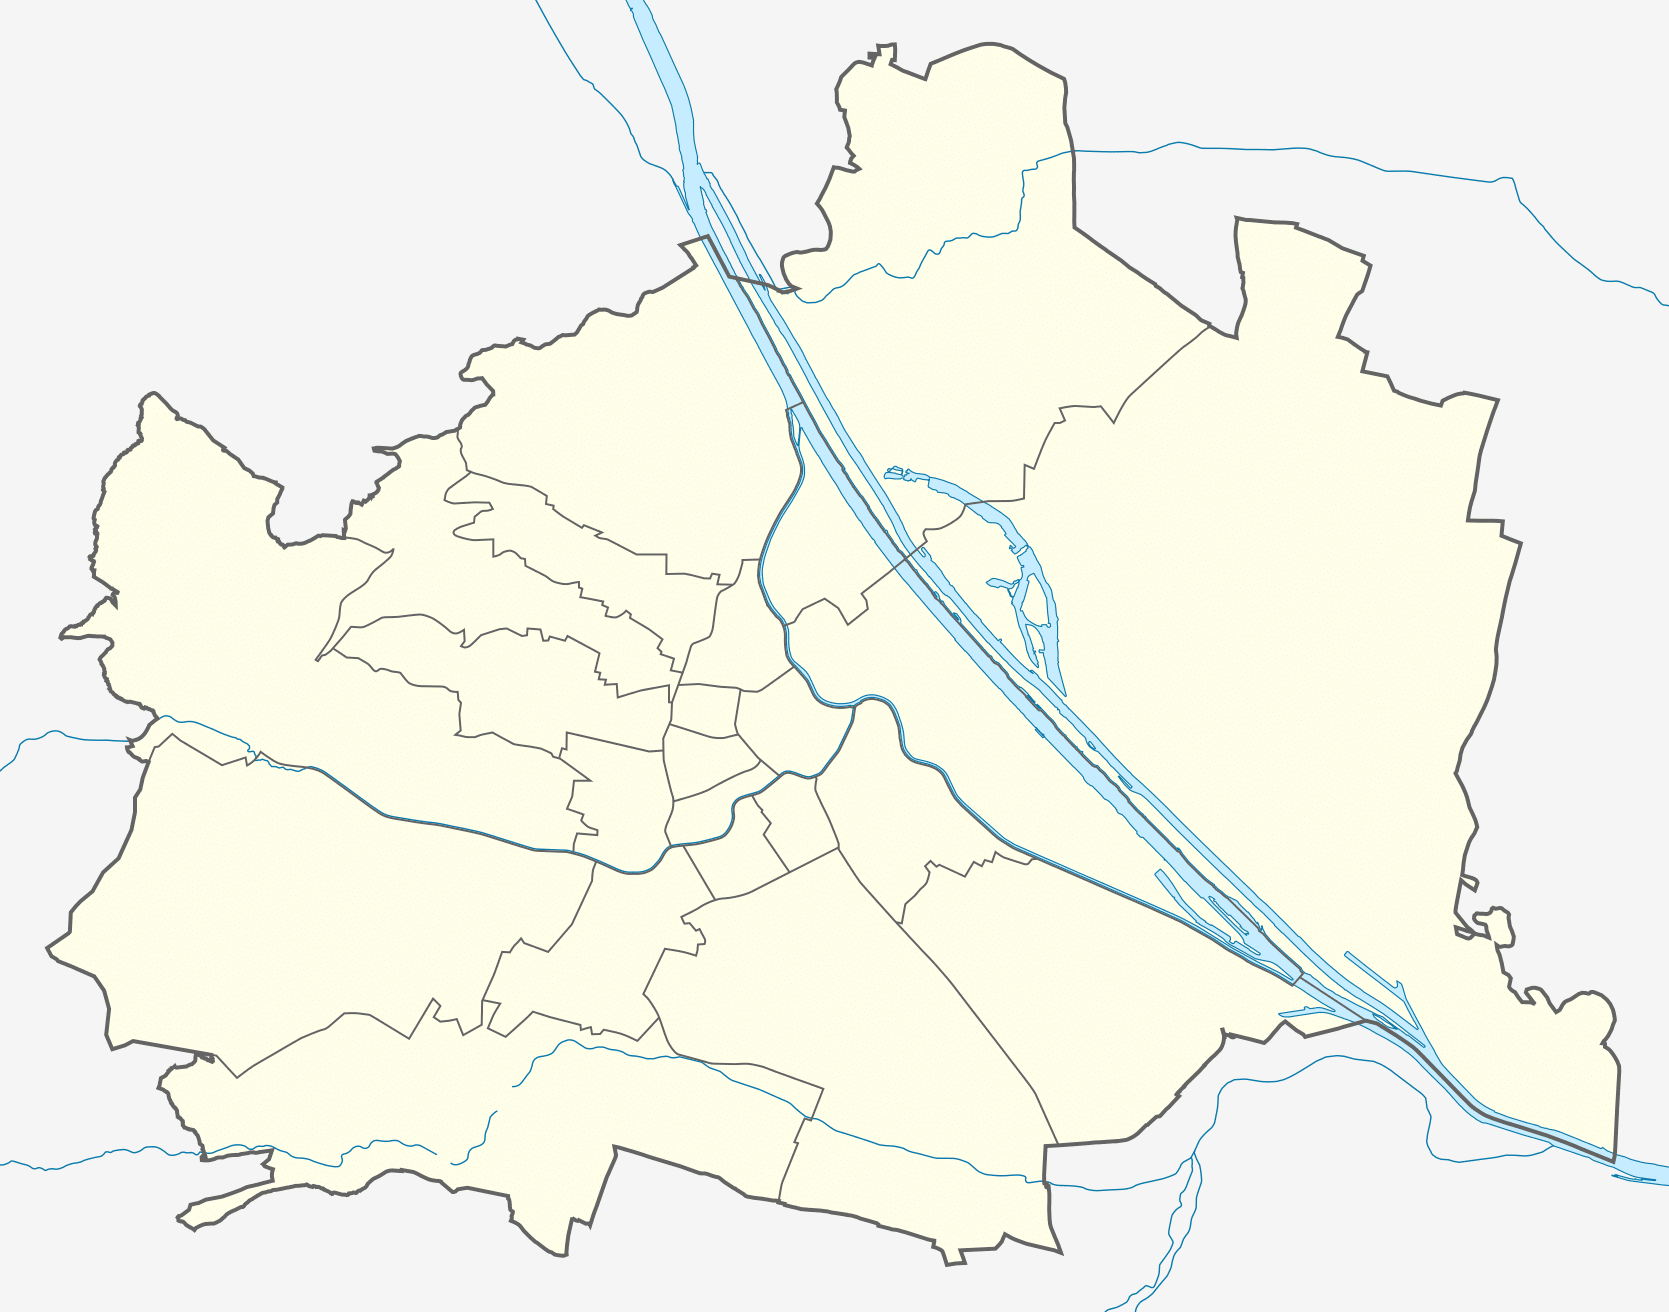 To address these challenges, EcoMove will develop knowledge-based solutions for efficient and environmentally sustainable movement in cities, providing customized information about available mobility options. Real-time recommendations for delaying, avoiding or taking alternative options will be presented visually to the users – city residents, visitors, and professional stakeholders – in order to prioritize “necessary” mobility. The City of Vienna will serve as the use case, but the developed methods will be generic and applicable to other cities and regions in follow-up projects.
Analytic Methods
EcoMove will analyze (i) the public debate in news and social media, (ii) open data sources such as DBpedia and public transport data, and (iii) anonymized movement data. Based on this integrated analysis, to be combined with predictive modeling, knowledge about mobility bottlenecks can be extracted. This refers to situations that exceed the nominal capacity, or capacity restrictions due to a disruption in a well-defined geographic region, for example crowding due to a demonstration. EcoMove will yield concrete recommendations for individual decision making, and generate data visualizations to communicate how personal mobility can become more sustainable by minimizing waiting times and prioritizing necessary travel.
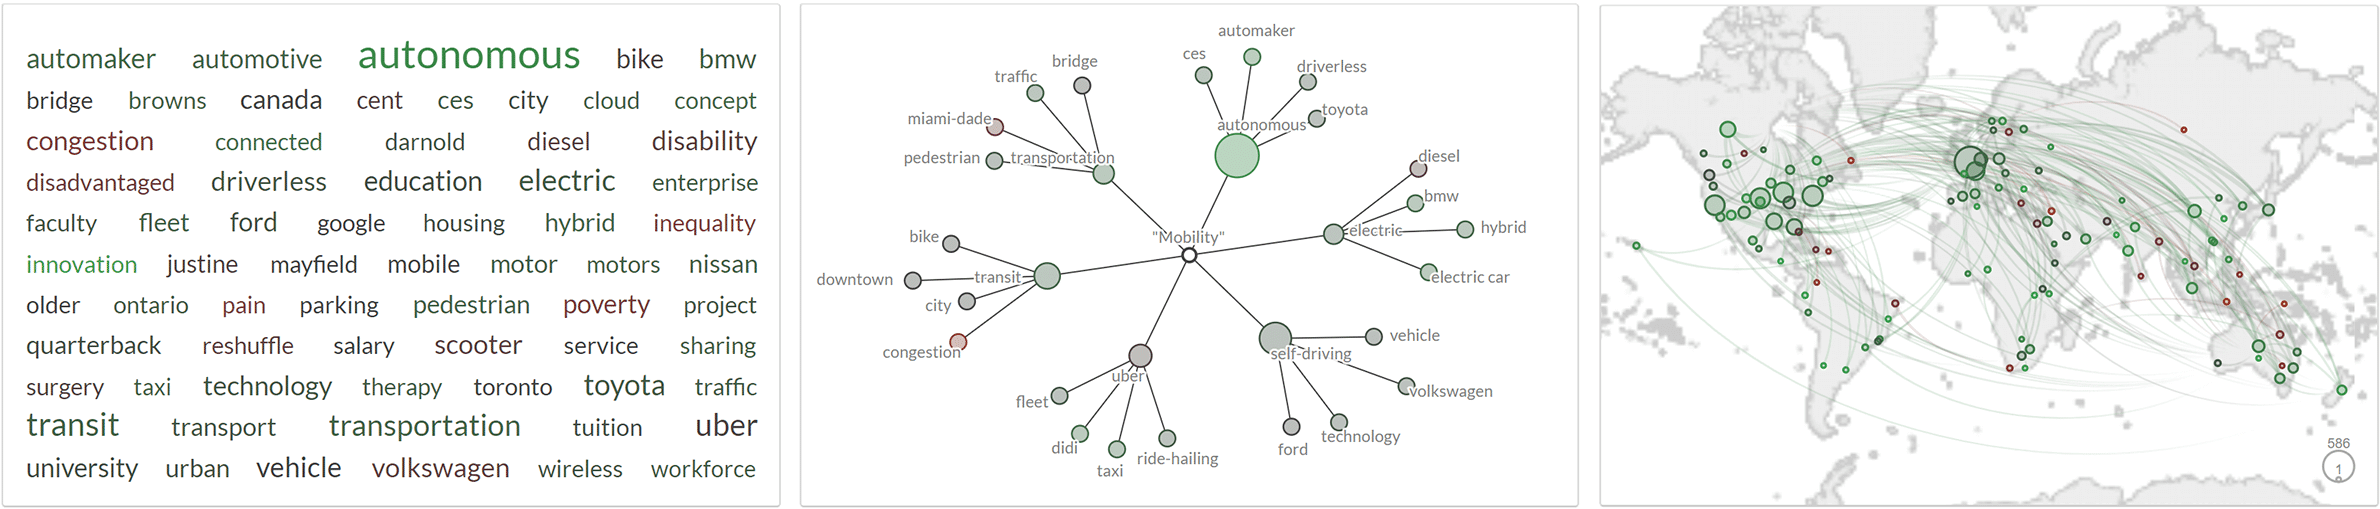
Based on novel algorithms to detect trends across multiple data sources, the EcoMove solution will predict future mobility bottlenecks. Recommendations will be based on a combination of historical data and automatically extracted knowledge from public (online) communication. The integrated data will be made available via data services and a mobility dashboard to support professional stakeholders in their planning. With respect to individual behavior, analysis of interaction data will help identify factors and stimuli to trigger behavioral change among residents and tourists alike – deviating from a planned route, for example, to avoid overcrowding.


