• Link to LinkedIn
  • Link to X
  • Link to Facebook
  • Link to Youtube
  • Link to Mail
Web Intelligence and Visual Analytics
webLyzard technology
  • Home
  • Solutions
    • Product Portfolio
    • Technology Showcases
  • Platform
    • Dashboard Overview
    • Visualization Tools
    • Data Services
  • Research
    • Research Projects
    • Horizon Europe Funding
    • Horizon Europe Dissemination
    • Publications
  • News
    • Latest Updates
    • Release History
    • Newsletter
  • About
    • Contact Details
    • Partners and Clients
    • Privacy Policy
  • Menu Menu
Dashboard Configuration | Web Intelligence Platform

Dashboard Configuration

The configuration menu controls the high-level settings of the dashboard. It allows customizing the user experience and tailoring the visual representation according to specific goals and tasks.

Available Options

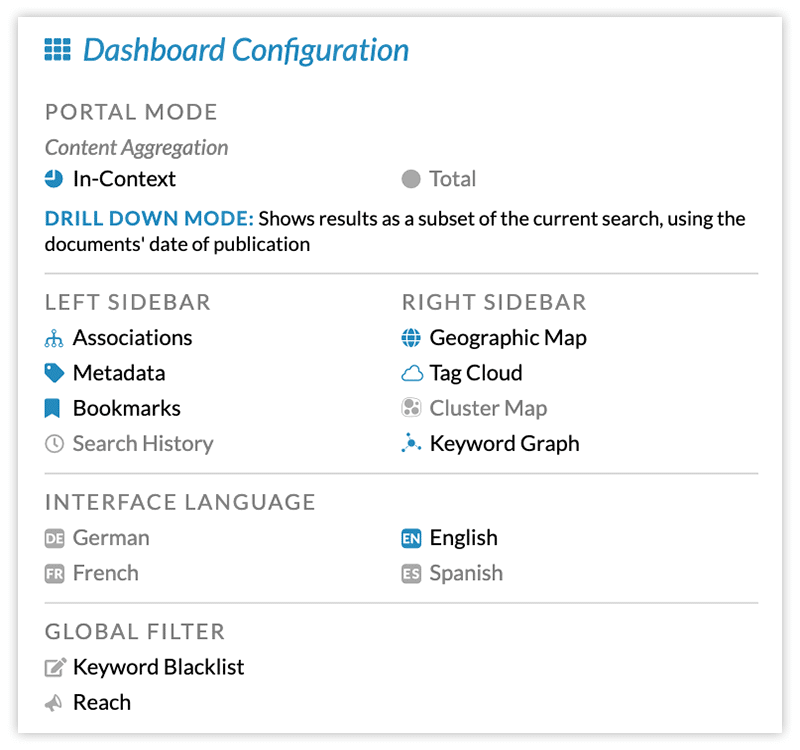
The most significant setting is the portal mode, which determines how search results are being aggregated (see detailed description below). In addition, the configuration menu controls the widgets to be shown in the left and right sidebars, the interface language used to formulate queries and display the results, and whether any global filters should be applied.

Currently, the dashboard configuration provides two filters are available. The keyword blacklist specifies words and phrases that should not be considered in the list of associations and keyword-based visualizations. The reach filter limits the shown results to sources exceeding a certain reach threshold – in the case of social media sources, for example, this allows focusing on users with a significant impact on the public debate and filtering out bots or recently created accounts with a limited audience.

Screenshot of Dashboard Configuration Overlay Menu

Portal Mode

When it comes to visual analytics, the requirements of communication experts vary widely. The workflow for an in-depth investigation of a brand, person or emerging issue is very different from benchmarking competitors or segmenting results by content source, region or language. webLyzard supports both scenarios:

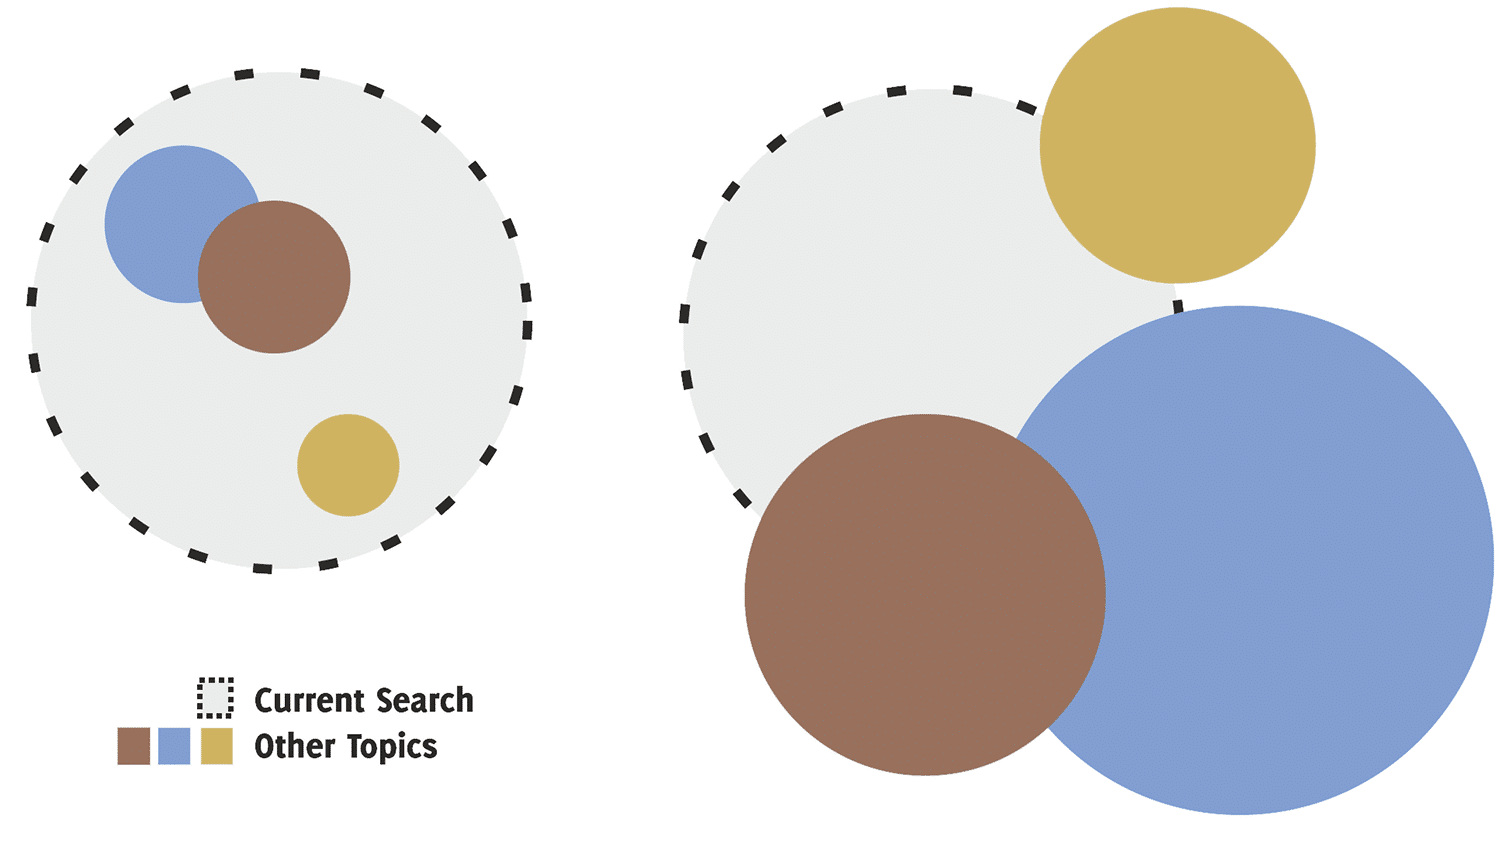
  • The drill-down mode allows investigating a specific topic. All the numbers shown in the left sidebar reflect the number of matches in the context of the current search (and therefore are always a subset of the latter). In this mode, the attributes of other sections in the left sidebar (e.g. sentiment in the metadata section, or predefined topics in the bookmarks section) serve as automated classifiers, segmenting the set of search results.
  • The comparison mode, by contrast, shows the total number of results in the left sidebar, for example to compare a brand with its competitors. In this mode, the current search (represented by a dotted line) becomes just one topic among several. The results of the other selected topics (shown in various colors) are independent of the current search.

The following diagram visualizes this distinction. In the drill-down mode on the left, all topics represent sub-sets of the current search. In the comparison mode on the right, they are independent and can overlap in various ways – which happens when documents contain terms that match multiple topic definitions.

Drill Down versus Comparison Mode

https://www.weblyzard.com/data/sites/21/dashboard-configuration.png 280 280 Arno Scharl https://www.weblyzard.com/data/sites/21/weblyzard-logo-2020.png Arno Scharl2019-03-24 14:35:242021-05-03 21:39:36Dashboard Configuration
Search Search

CATEGORIES

  • News & Events
  • Use Cases
  • Data Services
  • Visualizations
  • Research Projects

Recent Updates

  • AI Visibility Tracking – Monitoring Generative Engine ResultsJanuary 19, 2026 - 5:14 am
  • TRANSMIXR Presentation at IBC 2025 - Newsroom AI Toolbox
    Newsroom of the Future at IBC 2025September 29, 2025 - 9:42 pm
  • Sustainability Reporting with Generative AIJuly 20, 2025 - 11:59 am
  • CLAIM Project - Thumbnail
    Hybrid AI Models to Detect DisinformationApril 21, 2025 - 9:22 pm
  • Generative AI (GenAI) Thumbnail
    Generative AI for Content LifecyclesMarch 18, 2025 - 8:22 pm

About

webLyzard technology is an Austrian SME founded in 2008. The unique capabilities of its big data platform are based on a strong R&D track record in the fields of knowledge extraction, artificial intelligence, visualization and the integration of geospatial and semantic Web technologies.

web·Lyz·ard

Function: intelligence platform; Etymology: composed from web (as in World Wide Web) and lyzard (as in analyzer). 1 : (broadly) enriches digital content; identified by its speed, accuracy and scalability. 2 : predicts trends to gain a deeper understanding of information flows.

Visual Tools

  • Trend Chart Thumbnail
    Trend Chart – Dynamic Content MetricsOctober 18, 2020 - 9:00 am
  • Story Graph / Streamgraph Thumbnail
    Story Detection and Story Graph VisualizationApril 10, 2020 - 9:02 am
  • Geographic Map of Europe
    Geographic Map – Geospatial AnalyticsOctober 18, 2019 - 11:15 am

Data Services

  • AI Visibility Tracking – Monitoring Generative Engine ResultsJanuary 19, 2026 - 5:14 am
  • Wildcard Search and Regular Expressions
    Wildcard Search and Regular ExpressionsJanuary 9, 2025 - 4:46 am
  • Knowledge Graph - SKB - Thumbnail
    Knowledge Graph – Semantic Knowledge BaseNovember 28, 2024 - 10:00 am
Link to: GEN Summit – Global Editors Network Link to: GEN Summit – Global Editors Network GEN Summit – Global Editors NetworkWeb Intelligence and Visual Analytics Presentation at the GEN Summit 2018 - Arno ScharlLink to: Westeros Sentinel – Game of Thrones Analytics Link to: Westeros Sentinel – Game of Thrones Analytics Thumbnail of Game of Thrones - Westeros SentinelWesteros Sentinel – Game of Thrones Analytics
Scroll to top Scroll to top Scroll to top