• Link to LinkedIn
  • Link to X
  • Link to Facebook
  • Link to Youtube
  • Link to Mail
Web Intelligence and Visual Analytics
webLyzard technology
  • Home
  • Solutions
    • Product Portfolio
    • Technology Showcases
  • Platform
    • Dashboard Overview
    • Visualization Tools
    • Data Services
  • Research
    • Research Projects
    • Horizon Europe Funding
    • Horizon Europe Dissemination
    • Publications
  • News
    • Latest Updates
    • Release History
    • Newsletter
  • About
    • Contact Details
    • Partners and Clients
    • Privacy Policy
  • Menu Menu
Mobile Dashboard

Mobile Dashboard Version for Smartphones and Tablets

The mobile version of the webLyzard dashboard provides a user experience that is specifically tailored to the requirements of tablets, smartphones and other mobile devices. Ubiquitous access to digital content from different sources has never been easier. Fully compliant with HTML5 and other Web standards, the dashboard behaves like a native app on iPhone/iPad and Android devices. For desktop users, the mobile version provides a simple yet powerful alternative to the multiple coordinated views of the regular dashboard.

icons-watermark

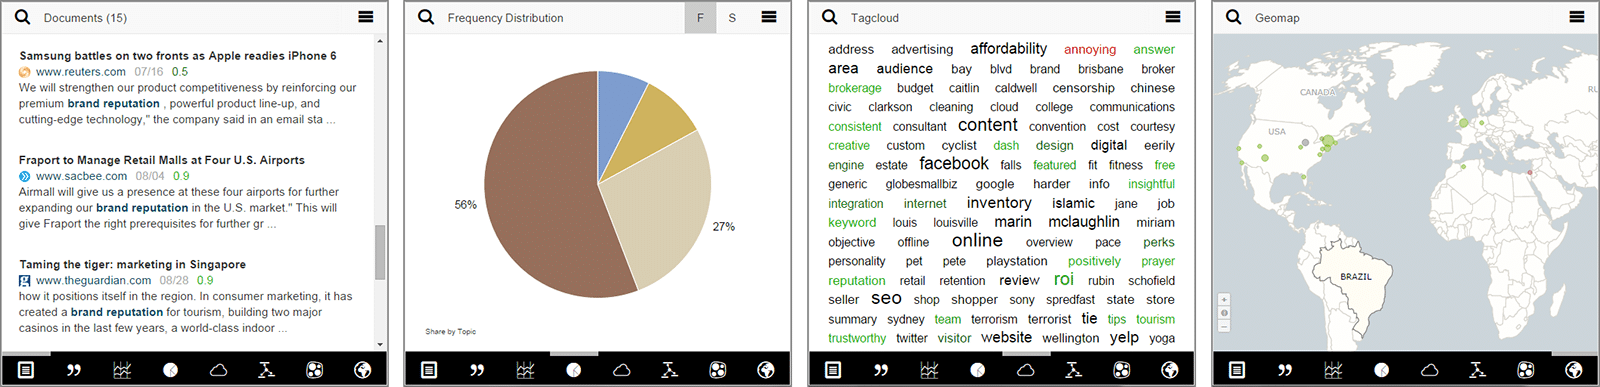
The icons at the bottom of the screen allow users to switch between eight different representations: (i) Document and Sentence View, (ii) Trend Chart, (iii) Pie Chart, (iv) Tag Cloud, (v) Keyword Graph, (vi) Cluster Map, and (vii) Geographic Map. Two additional icons let users define their search queries:

  • Search. The magnifying glass icon in the upper left corner opens a sidebar with a search box. The auto-complete function is particularly useful for mobile devices by minimizing the required input. Its suggestions include keywords and identified entities (people, organizations and locations). The clickable terms underneath the text box allow users to quickly access previously defined topics.
  • Source and Date Selection. The settings icon in the upper right corner opens a sidebar to select and deselect the available sources (news, social media, etc.), and to limit the search results to a specific time interval.

mobile-dashboard-screenshots


Responsive Design

While preserving the fundamental design principles of the webLyzard dashboard, the mobile version aims to simplify the interaction and focus the user’s attention on one particular data representation. The dashboard is responsive and adjusts the layout to the size of the browser window, and to its aspect ratio when switching between portrait and landscape mode on mobile devices. This flexibility ensures instant access to Web intelligence in a wide range of usage scenarios – checking the latest market developments while traveling, for example, accessing the platform with limited bandwidth, or showing a secondary window while working on other tasks.

Touch Inputs

Following best practices of mobile application design, the mobile dashboard supports direct manipulation using touch inputs that loosely correspond to real-world actions. Examples include swiping to switch between the above-mentioned representations, pinching and reverse pinching to zoom in and out on the geographic map, and tapping to trigger searches or to interact with visual elements. Highly optimized rendering algorithms enable immediate processing of user input and provide users with a fluid multi-touch interface experience.

https://www.weblyzard.com/data/sites/21/mobile-dashboard-thumbnail.png 280 280 Arno Scharl https://www.weblyzard.com/data/sites/21/weblyzard-logo-2020.png Arno Scharl2014-10-29 23:24:342020-11-21 10:19:21Mobile Dashboard Version for Smartphones and Tablets
Search Search

CATEGORIES

  • News & Events
  • Use Cases
  • Data Services
  • Visualizations
  • Research Projects

Recent Updates

  • AI Visibility Tracking – Monitoring Generative Engine ResultsJanuary 19, 2026 - 5:14 am
  • TRANSMIXR Presentation at IBC 2025 - Newsroom AI Toolbox
    Newsroom of the Future at IBC 2025September 29, 2025 - 9:42 pm
  • Sustainability Reporting with Generative AIJuly 20, 2025 - 11:59 am
  • CLAIM Project - Thumbnail
    Hybrid AI Models to Detect DisinformationApril 21, 2025 - 9:22 pm
  • Generative AI (GenAI) Thumbnail
    Generative AI for Content LifecyclesMarch 18, 2025 - 8:22 pm

About

webLyzard technology is an Austrian SME founded in 2008. The unique capabilities of its big data platform are based on a strong R&D track record in the fields of knowledge extraction, artificial intelligence, visualization and the integration of geospatial and semantic Web technologies.

web·Lyz·ard

Function: intelligence platform; Etymology: composed from web (as in World Wide Web) and lyzard (as in analyzer). 1 : (broadly) enriches digital content; identified by its speed, accuracy and scalability. 2 : predicts trends to gain a deeper understanding of information flows.

Visual Tools

  • Trend Chart Thumbnail
    Trend Chart – Dynamic Content MetricsOctober 18, 2020 - 9:00 am
  • Story Graph / Streamgraph Thumbnail
    Story Detection and Story Graph VisualizationApril 10, 2020 - 9:02 am
  • Geographic Map of Europe
    Geographic Map – Geospatial AnalyticsOctober 18, 2019 - 11:15 am

Data Services

  • AI Visibility Tracking – Monitoring Generative Engine ResultsJanuary 19, 2026 - 5:14 am
  • Wildcard Search and Regular Expressions
    Wildcard Search and Regular ExpressionsJanuary 9, 2025 - 4:46 am
  • Knowledge Graph - SKB - Thumbnail
    Knowledge Graph – Semantic Knowledge BaseNovember 28, 2024 - 10:00 am
Link to: Newsletter Signup and Archive Link to: Newsletter Signup and Archive Newsletter Signup and ArchiveInsight NewsletterLink to: US Climate Resilience Toolkit Link to: US Climate Resilience Toolkit Climate Resilience Toolkit LogoUS Climate Resilience Toolkit
Scroll to top Scroll to top Scroll to top