Climate.gov – Search and Visual Navigator
Officially launched on 12 October 2021, the Climate.gov portal of the National Oceanic and Atmospheric Administration (NOAA) uses webLyzard’s search and visualization engine to offer scientific knowledge and the latest insights into climate-related issues. The wide range of resources includes news, teaching materials, magazines, maps and comprehensive datasets for professional users.
“Given the abundance of available information, it can be difficult for users to keep an overview and find the most relevant insights. The semantic search technologies of webLyzard address this problem by automatically enriching NOAA’s online content with metadata and visualizing the results of user queries”.
 David Herring
Director of Communications at the Climate Program Office of the U.S. National Oceanic and Atmospheric Administration (NOAA)
Content Recommendations and Visual Tools to Guide Decisions
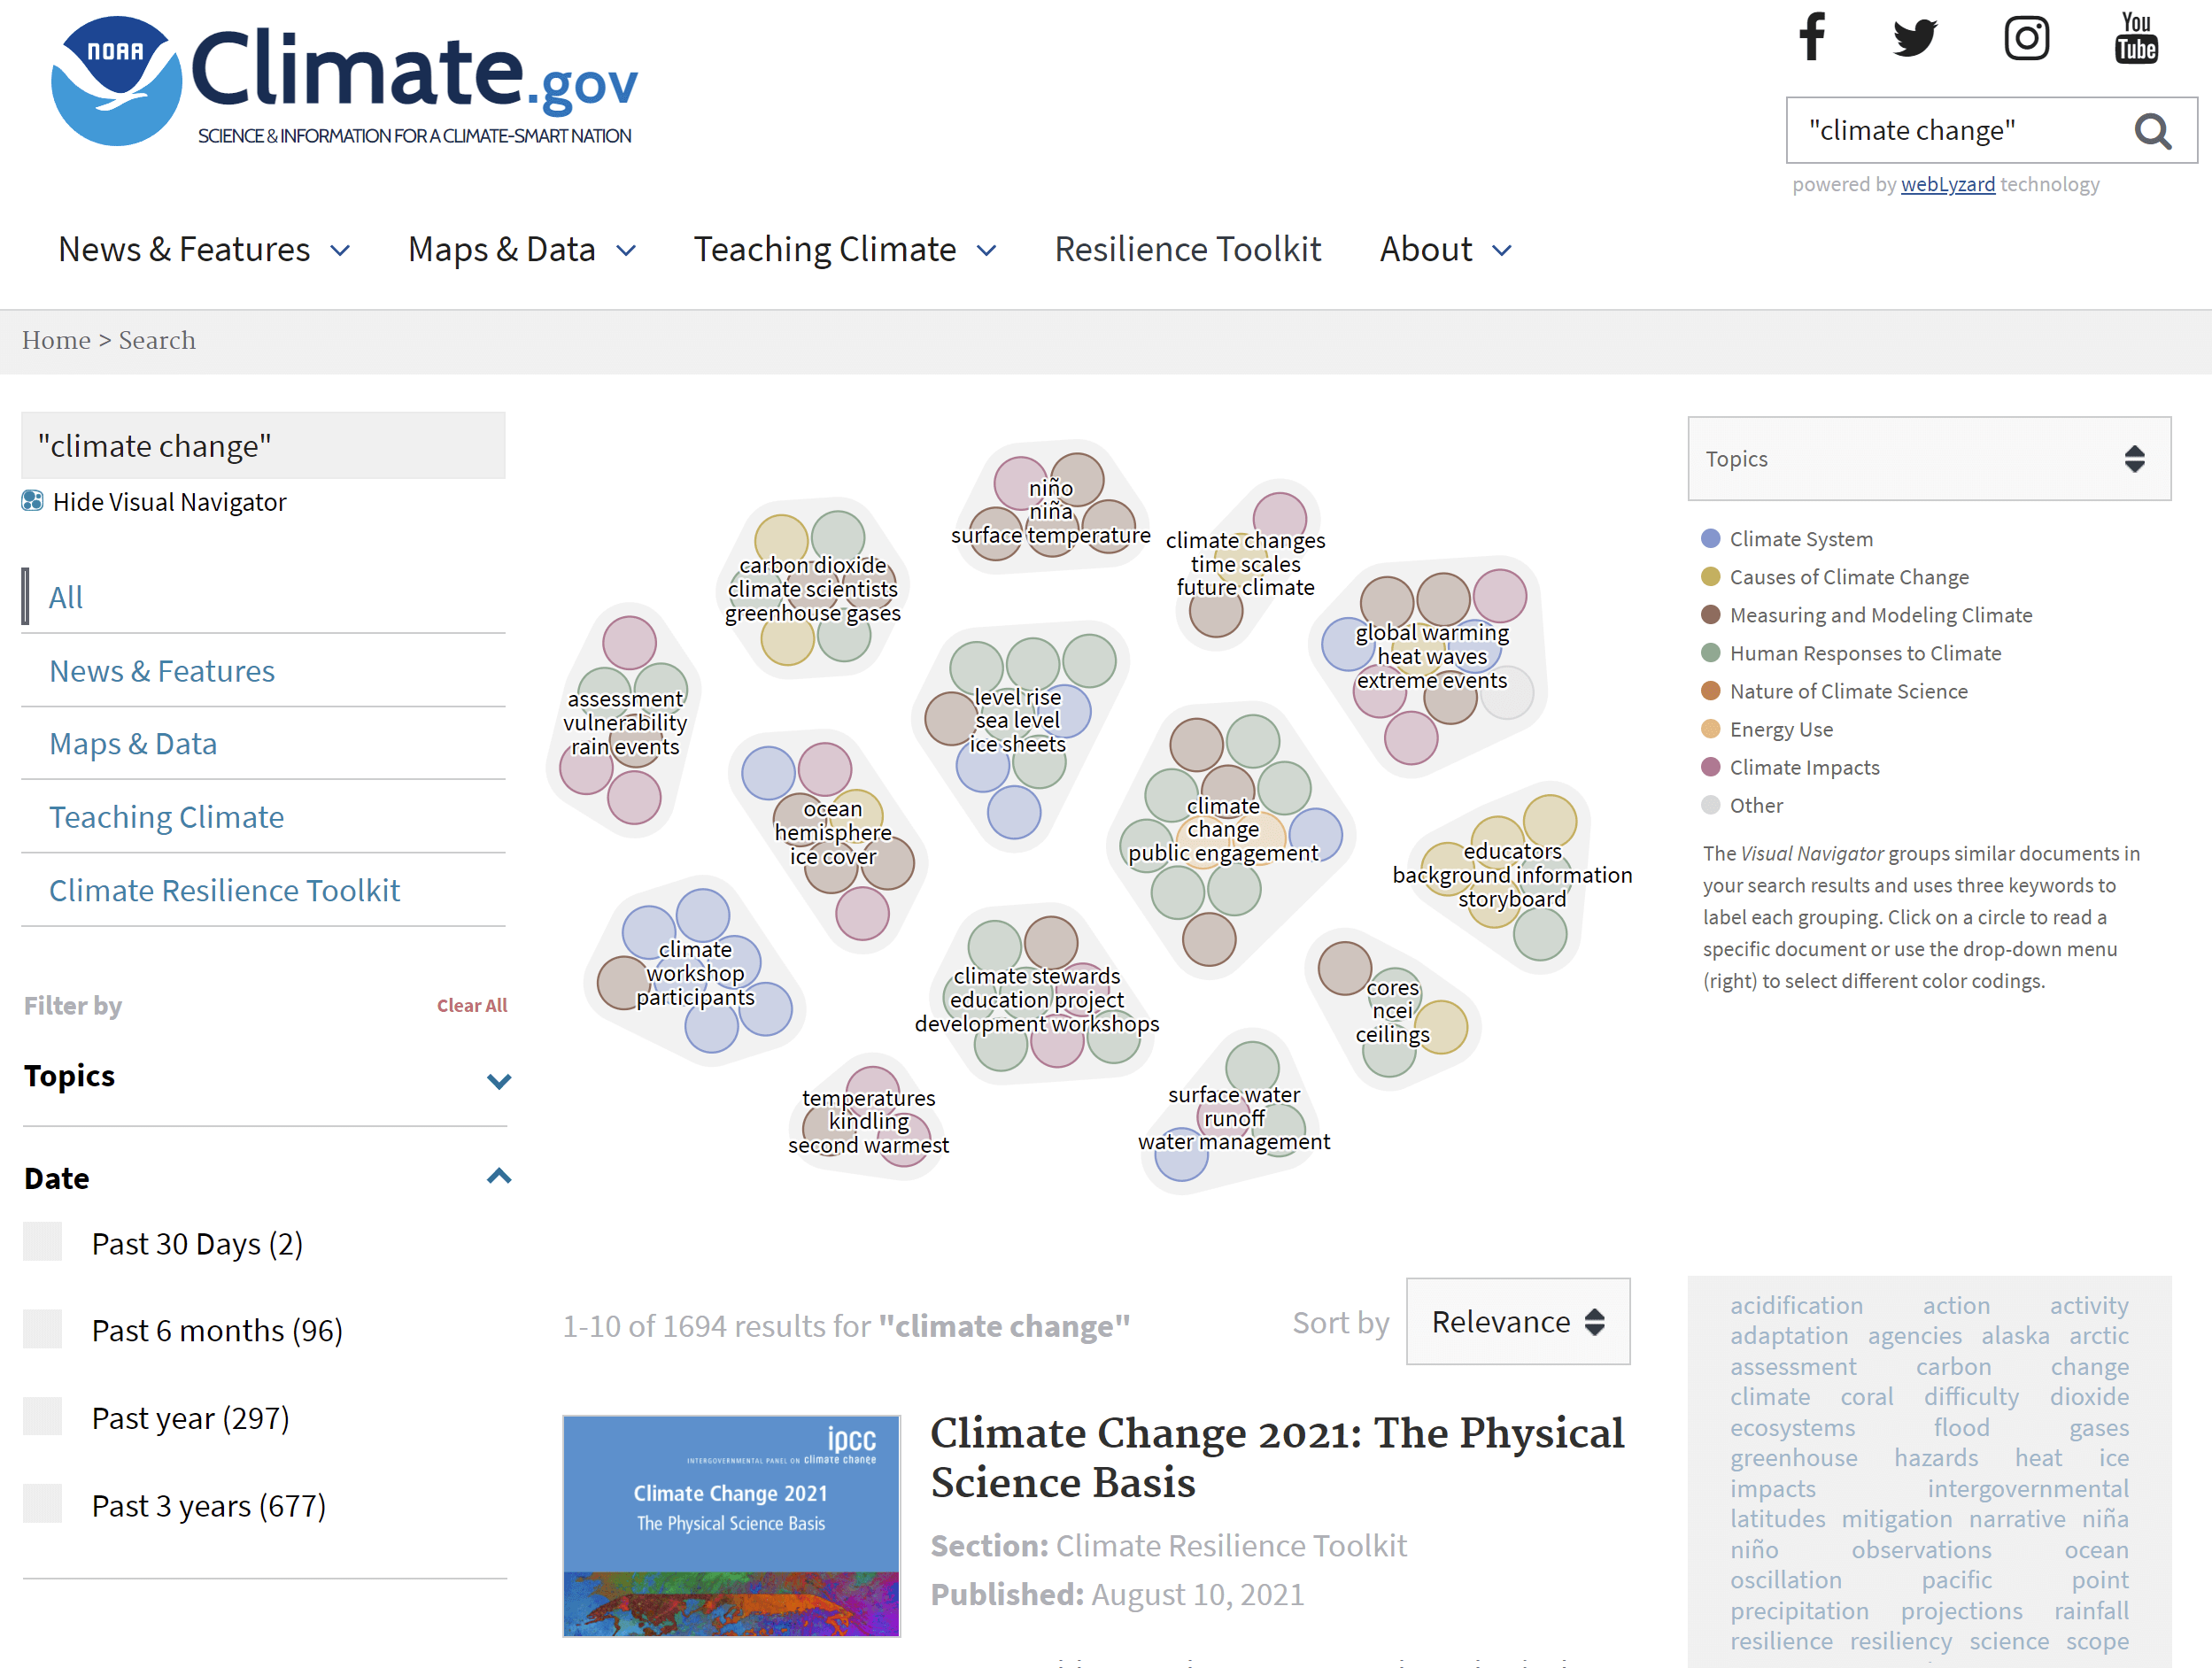
Interactive visualizations show the widespread impact and interconnectedness of climate change-related topics. The Visual Navigator, for example, uses story detection in conjunction with a dynamic cluster map visualization to group similar documents in the set of search results. Three keywords describe the content of each cluster. Clicking on a circle leads to a specific document. The drop-down on the right provides different color codings to reveal metadata such as the publication date or topical, geographical or functional classifications.
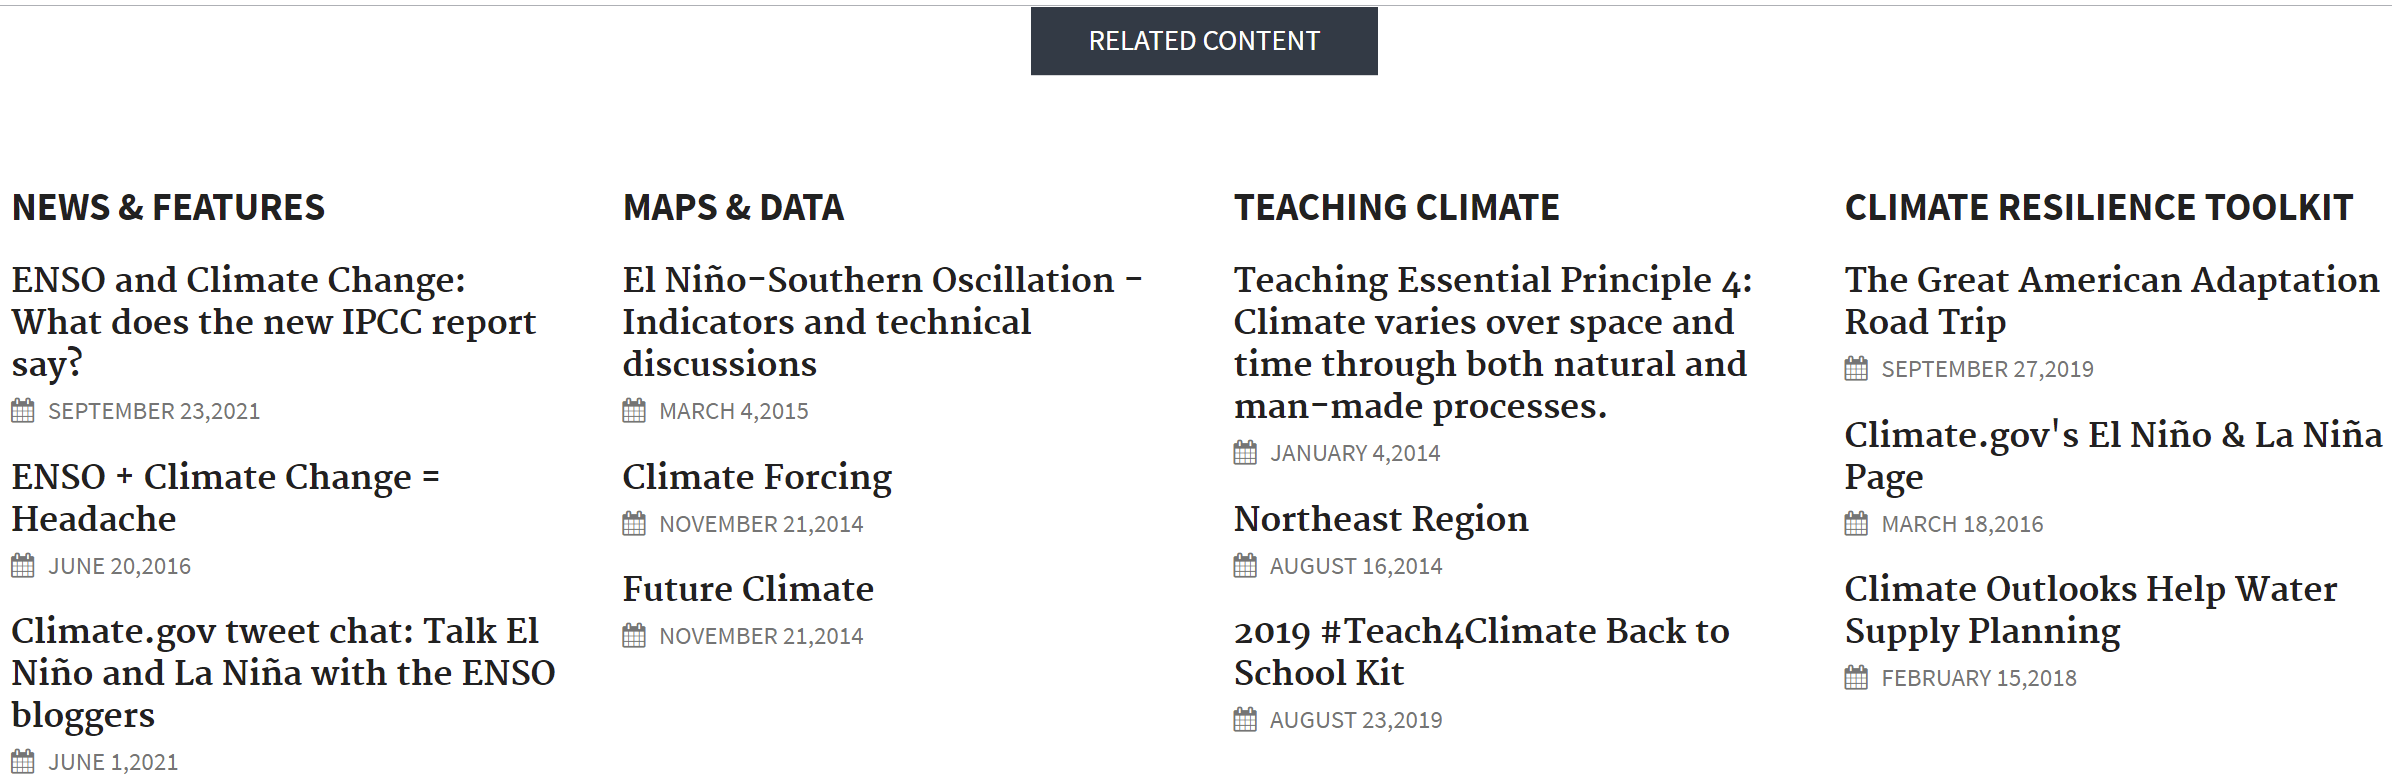
The semantic search of webLyzard not only helps users identify the most relevant documents. It also lets them explore related content in a visual manner. The figure below shows the corresponding section of a typical Climate.gov page. The system integrates links to the web content of other government agencies, research centers and publicly funded climate projects as well. This gives a comprehensive overview of the state of climate science and how it impacts many other domains.
COP 26 – On the Road to Glasgow
US President Joe Biden has set some important milestones in the global fight against climate change. Shortly after taking office, the President signaled his priority for taking action to address the challenges of human-caused global warming. Today, the President’s Executive Order is being translated into concrete actions, summarized in a White House Fact Sheet that outlines strategies to make climate information and decision tools more accessible. The launch of the new Climate.gov portal is an important milestone in this direction, particularly in light of the upcoming United Nations Climate Change Conference (COP-26) to be held in Glasgow between 31 Sep and 12 Nov 2021.
Sustainable Innovation for a Good Cause
Successful cooperation with NOAA has a long tradition for webLyzard, since the year of our foundation in 2008. We already provided the semantic search for the US Climate Resilience Toolkit, which was published in 2014 in response to Barack Obama’s Climate Action Plan. In addition to the collaboration with the NOAA Climate Program Office, webLyzard technology actively participates in other international sustainability projects. Our team has developed a Web Intelligence solution for the United Nations Environment Programme (UNEP), for example, which tracks global media coverage about the Sustainable Development Goals (SDGs).
We continuously evolve the underlying methods in Austrian and European research projects, such as the trend forecasts of the EPOCH project financed by the Austrian Federal Ministry for Climate Protection (BMK) and the Research Promotion Agency (FFG), or the visualizations of the EU projects EVOLVE and inDICEs. This puts webLyzard in an ideal position to further expand its research portfolio within the Horizon Europe program of the European Union in order to support the European Green Deal.

