Geographic Map – Geospatial Analytics
When you search for a topic, webLyzard analyzes the set of matching documents to determine all referenced locations in multiple sources. The geographic map is a visual tool to explore such spatial datasets, for example to investigate the regional distribution of news articles or social media postings.
The notion of a Geospatial Web [1], or GeoWeb, has inspired our work for the better part of the last two decades. The Sagebrush Lizard release took webLyzard’s geospatial analytics capabilities to a new level. We rebuilt the geographic map module from scratch for optimized performance and a more effective information design. Custom base layers, adaptive tooltips and time-sliced animations increase the versatility of the component for various types of tasks. Moreover, different export options and the ability to embed the component enable its reuse in external GeoWeb applications.
Try out the dashboard at unep.ecoresearch.net
Layout and Data Representation
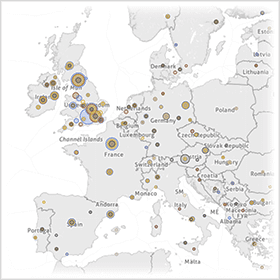
User interactions trigger dynamic updates of the map. Thereby, the system sheds light on the geographic context of a query without interrupting your workflow. Depending on their size, circles represent single documents or document clusters:
- The position of circles marks the coordinates (longitude and latitude) of cities, countries, landmarks, etc. discovered in the documents.
- The size of the circles reflects the number of documents referring to a specific position.
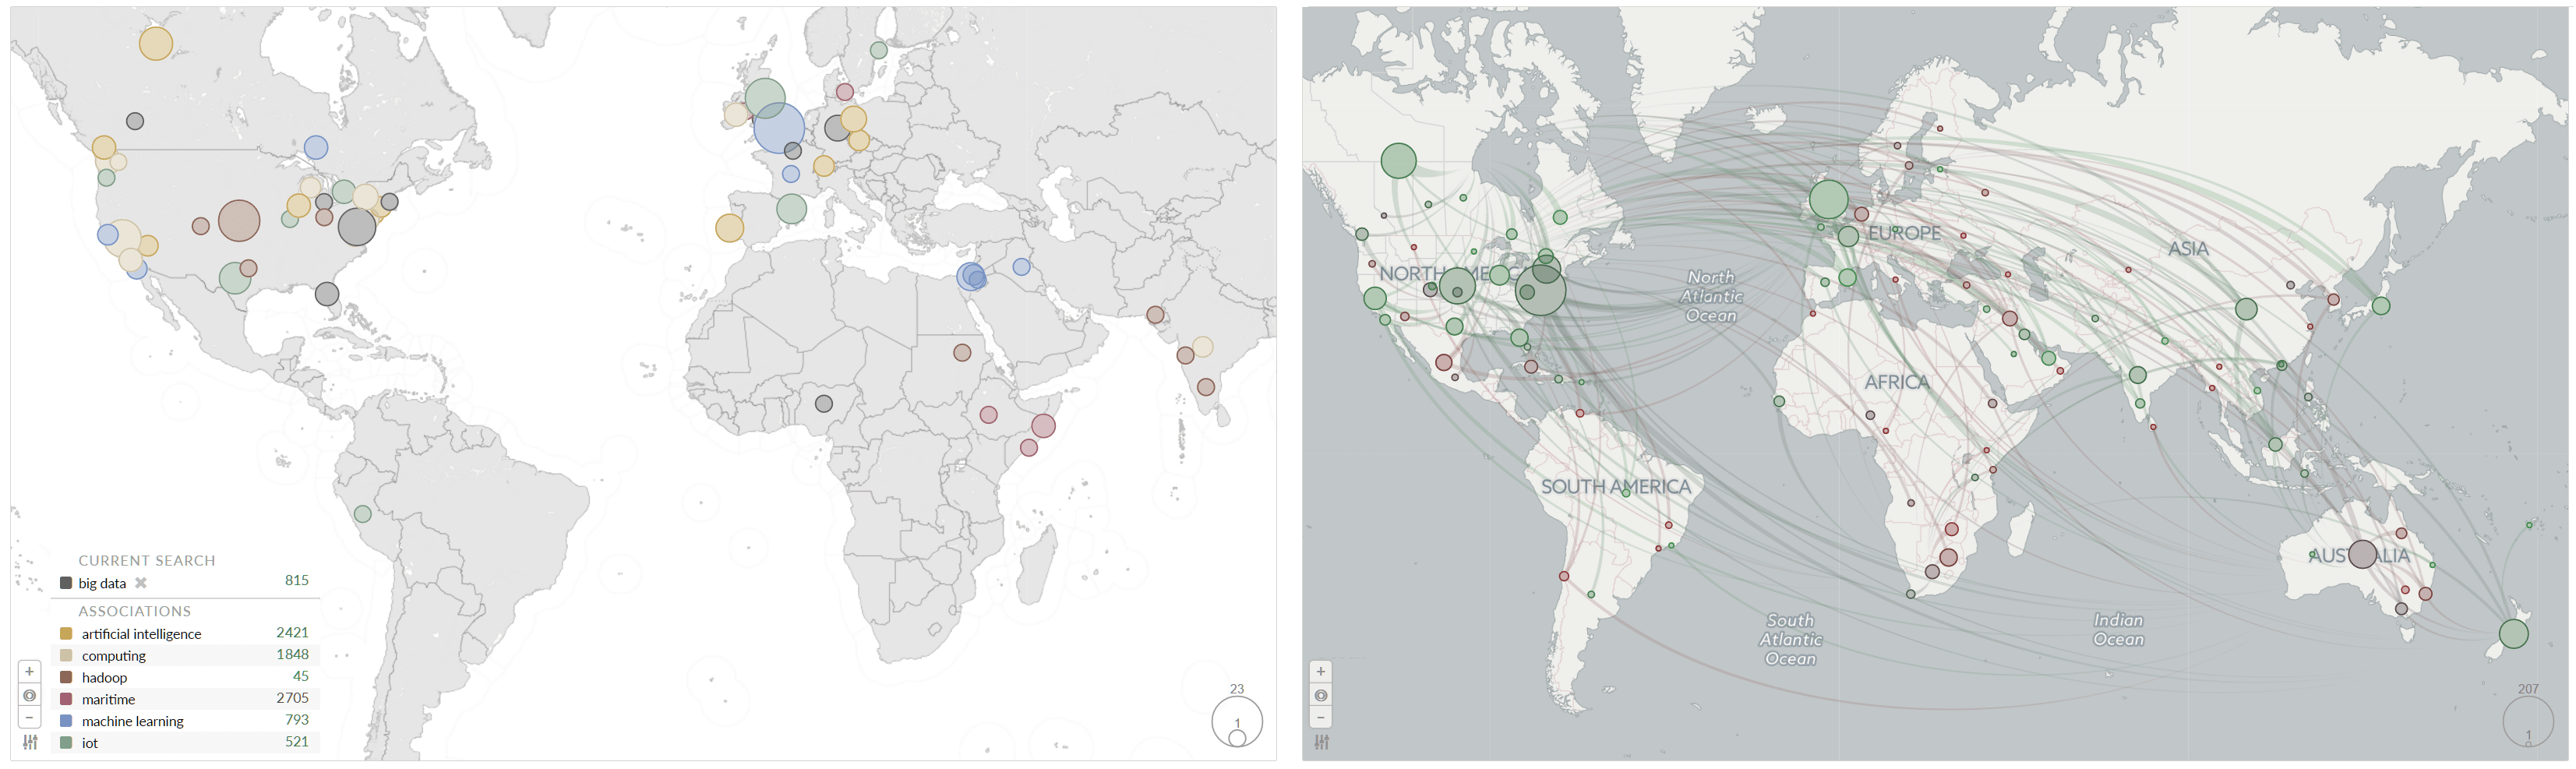
- The color indicates one of the selected topics or metadata attributes. In the case of sentiment, for example, the color ranges from red (negative) to grey (neutral) and green (positive).
- Optional Arcs connect referenced geographic entities with the origin of the documents. Typically, this origin is the location of the author or publisher. This feature allows analysts to explore frequent mentions of a location in a country’s media channels.
Interactive Geographic Map Features
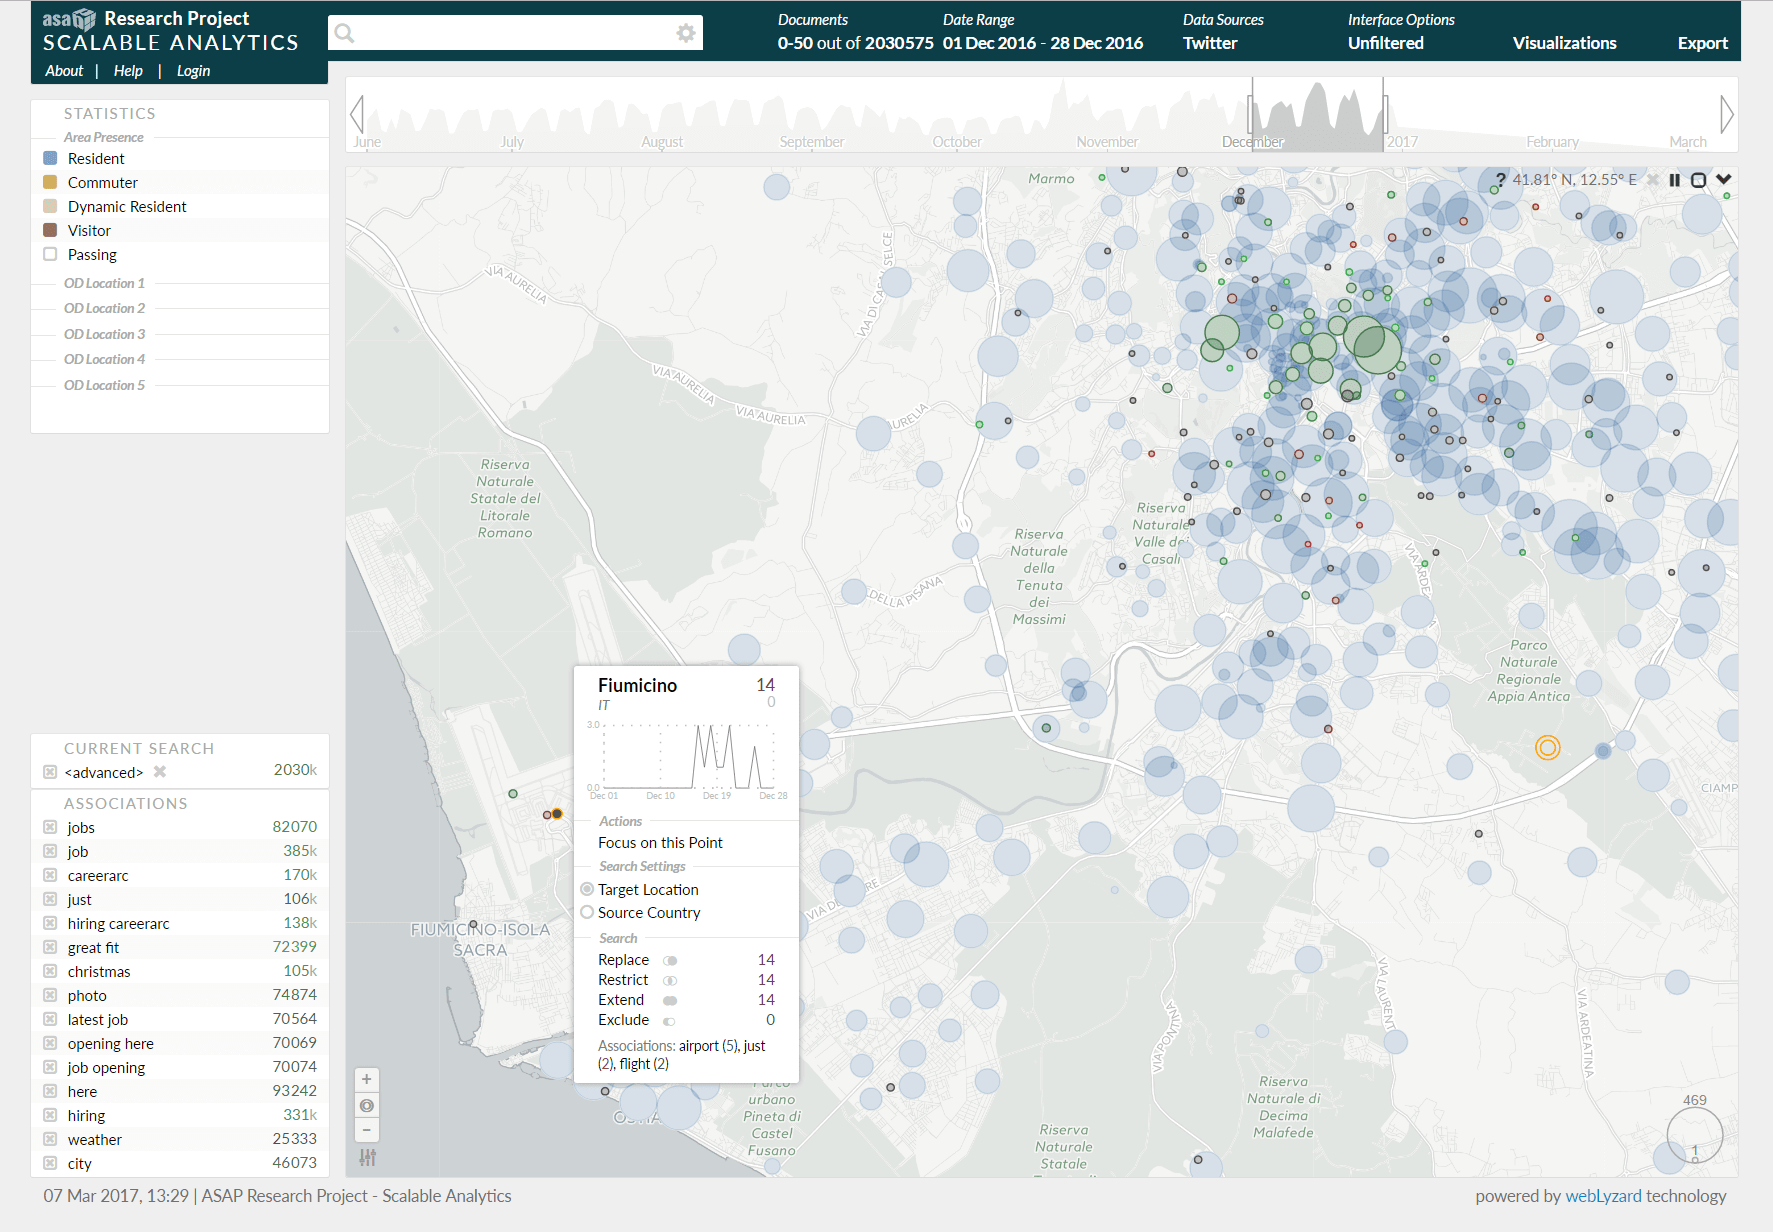
The full potential of geographic maps and virtual globes in GeoWeb applications unfolds with effective drill-down capabilities. For this purpose, our tooltip displays the most relevant information in a local context. It also allows restricting or extending the search:
- Hover over a circle to activate a document preview and tooltip. The tooltip presents a line chart preview and top associations with this location. Increased opacity shows all arcs pointing to this location. This highlights where the authors discuss this location.
- Click on a circle or country for context-specific actions: (i) Focus on this Point to show results within a certain radius, (ii) Replace the current search with a search for mentions of this location, and (iii) Restrict or Extend the search via Boolean operators (AND, OR).
- Zoom via the mouse wheel or a double click, or click and drag for seamless panning of the display. Both operations trigger new queries to update the map. This results in richer and more detailed visualizations without cluttering the display. This strategy also avoids slowing down the display at lower zoom levels.
Dynamic Geographic Map Rendering
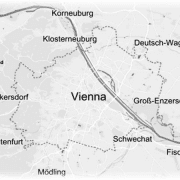 For the geospatial analytic mapping, we use Scalable Vector Graphics (SVG) and D3.js to render interactive elements. While simple shapes are great for getting a quick overview, they can lack the desired level of detail. When focusing on a city like Vienna (Austria), for example, district borders, landmarks and individual streets are important points of reference to consider in the geographic layout.
Advancing the State of the Art in Geospatial Analytics
 Developed in the ASAP and EVOLVE big data research projects, the geographic map supports very large datasets. It has been tested successfully with search queries returning more than 100 million documents. The screenshot above shows a street-level display with a tooltip for on-the-fly query refinements. The blue markers present anonymized cell tower activity data for the City of Rome. The system then overlays this information with geotagged Twitter postings (green = positive; red = negative). Thereby, analysts can easily discover communication hotspots during an event. This shows how semantic technologies together with advanced visual tools can transform statistical data into valuable repositories of actionable knowledge for interactive geospatial analytics applications.

