PDF Report Generator
The PDF Report Generator creates automated summaries of analytic results based on a search query or topic definition. It makes use of webLyzard’s portfolio of high-quality visualizations to produce professionally designed PDF reports. Optimized for print, such reports widen the platform’s target group beyond the users of the interactive dashboard. Thereby, they unlock many new application scenarios.
Download a sample report on Tesla Motors
Embedded into daily workflows, automated reports often serve as weekly management updates. They are equally useful as detailed on-the-fly briefings on recent events, or to shed light on the social perceptions of an issue.
PDF Report Types
The PDF Report Generator offers a selection of five different report types. The following paragraphs summarize the available options. Independent of the chosen type, the header always contains the search term, the date range as well as the chosen sources and languages:
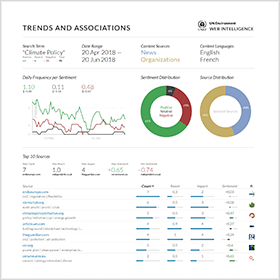
Trends and Associations
Two trend charts on the left show recent trends in daily coverage per sentiment category and source. A third chart on the right complements the display to compare sentiment across sources. Colored indicators represent average values, while small numbers next to the arrows indicate the change between the first and last day. In the upper right corner, two donut charts depict the overall distribution by sentiment and source. Underneath, a tag cloud and keyword graph summarize the most important semantic associations with the search term.
Cross-Media Analysis
A scatterplot and frequency-sorted table present the top sources reporting about the search term. The size of the bubbles shows the overall reach of a source. Their color ranges from red (negative) to grey (neutral) and green (positive). The table includes the top 3 keywords that a given source associates with the search term, the number of mentions, the reach of the source, the impact of the coverage (multiplying reach and the number of mentions), and the average sentiment expressed by each source.
Opinion Leadership
Similar to the cross-media analysis, the scatterplot shows how often persons were mentioned together with the search term. It also conveys whether this was done in a positive or negative context. The size of the bubbles indicates a person’s overall number of mentions in the chosen time interval, independent of the search query. The table lists the identified opinion leaders together with associated keywords, the number of co-occurrences with the search term and the average sentiment of these co-occurrences.
Geographic Distribution
The regional distribution of search results shown on a geographic map is followed by a corresponding list of locations (countries, states or cities) that are most frequently mentioned together with the search term – including top keywords to highlight regional differences in the coverage, the number of times a specific location is mentioned together with the search term, and the average sentiment of these mentions.
Sentence Analysis
Three tables show the most recent, the most positive and the most negative sentences that contain the search term within the chosen time interval (filtering out redundant or very short sentences). The tables are followed by a word tree, which is a graph-based tool to quickly grasp the major threads in a public debate. The branches on both sides help to spot important expressions that often precede or follow the search term. Please note that the sentence analysis report is not available for asterisk (*) wildcard searches.
How to Access the PDF Report
The Export drop-down of the dashboard’s header menu provides access to the reports. Users can create individual reports or convert them into a single multi-page document. The integrated document contains all the selected report types. The PDF report generator functionality is not only available to dashboard users, but can also be embedded into external applications such as the Storypact editor.
Last major update with release 2020-06 (Sagebrush Lizard).

